


US Transportation Index Suggests Stock Market Bottom May Be Forming
Stock-Markets / Stock Markets 2018 Oct 12, 2018 - 01:48 PM GMTBy: Chris_Vermeulen

 Our research team, at www.TheTechnicalTraders.com, is alerting our members that the Transportation Index has reached its first level of support near 10,500 and this level may be the start of an extended bottoming formation. If you have been following our research posts, you already know that we predicted this recent downside price swing over 3 weeks ago with our Adaptive Learning Predictive Modeling systems. You will also understand that our modeling systems suggest this move may not end till early November (somewhere between November 8~12). Keeping this in mind, we are now alerting you to be prepared for the following.
This Weekly US Transportation Index chart highlights what we believe will become support for the US stock markets. The 10,500 level, highlighted by the GREEN horizontal line, is a key support level that goes all the way back to late 2017 and early 2018. This level will likely present strong support for the Transportation Index and, thus, for the US stock markets in general. We do expect the continued downside pricing pressures to test this level over the next few weeks, but we are beginning to think we may be setting up for an extended bottom formation that may include many weeks of volatility and sideways price rotation.
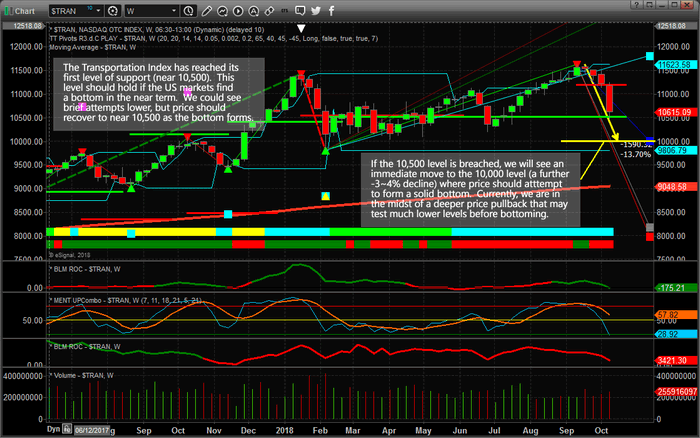
If the 10,500 level is breached, secondary support exists at the 10,000 level (only 500 pts below). As dramatic as that move will be, if it happens, this suggests that any attempt to move to near this level could be considered a “wash-out low” price rotation – a typical bottom formation. At this point, we believe the 10,500 level is holding as we are not seeing extended downside price action in the current market. If the US stock market was severely threatened by internal or external factors, we believe we would have seen much deeper follow-through the day after the massive price collapse.
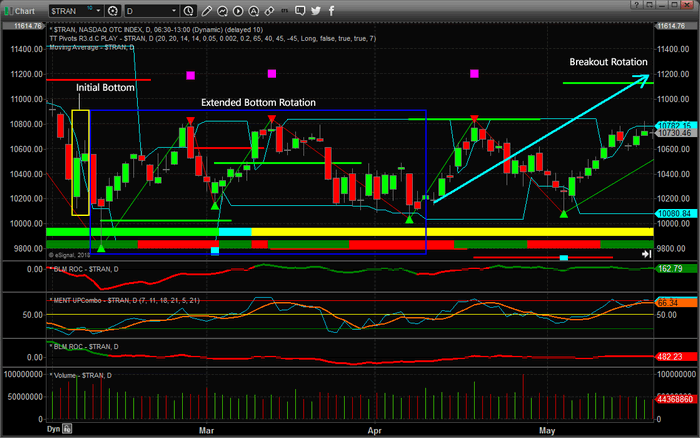
What does an extended bottoming formation look like and what should we expect over the next few weeks? Please take a look at this Daily Transportation Index chart that shows an earlier example of extended bottoming and bottom price rotation before a recent upside price move. This example clearly shows how the initial bottom setup (highlighted in YELLOW) forms prior to an extended period or “basing” or bottoming price rotation. We don’t expect many months of this type of bottoming price rotation. We expect this bottom to setup and form over a period of about 2~3 weeks before a new uptrend begins to form. Overall, this is a good example of how an extended bottom is formed before an upside price move initiates.
We urge you to pay attention to our posts and to visit www.TheTechnicalTraders.com to learn more about how we can help you navigate these markets. Please take a minute to visit our website and learn how we continue to work to assist our members with clear and effective analysis, research and trading signals every day. It really makes a world of difference when you have a dedicated team of researchers using specialized proprietary price modeling systems to help you stay ahead of these market moves.
Chris Vermeulen
www.TheTechnicalTraders.com
Chris Vermeulen has been involved in the markets since 1997 and is the founder of Technical Traders Ltd. He is an internationally recognized technical analyst, trader, and is the author of the book: 7 Steps to Win With Logic
Through years of research, trading and helping individual traders around the world. He learned that many traders have great trading ideas, but they lack one thing, they struggle to execute trades in a systematic way for consistent results. Chris helps educate traders with a three-hour video course that can change your trading results for the better.
His mission is to help his clients boost their trading performance while reducing market exposure and portfolio volatility.
He is a regular speaker on HoweStreet.com, and the FinancialSurvivorNetwork radio shows. Chris was also featured on the cover of AmalgaTrader Magazine, and contributes articles to several leading financial hubs like MarketOracle.co.uk
Disclaimer: Nothing in this report should be construed as a solicitation to buy or sell any securities mentioned. Technical Traders Ltd., its owners and the author of this report are not registered broker-dealers or financial advisors. Before investing in any securities, you should consult with your financial advisor and a registered broker-dealer. Never make an investment based solely on what you read in an online or printed report, including this report, especially if the investment involves a small, thinly-traded company that isn’t well known. Technical Traders Ltd. and the author of this report has been paid by Cardiff Energy Corp. In addition, the author owns shares of Cardiff Energy Corp. and would also benefit from volume and price appreciation of its stock. The information provided here within should not be construed as a financial analysis but rather as an advertisement. The author’s views and opinions regarding the companies featured in reports are his own views and are based on information that he has researched independently and has received, which the author assumes to be reliable. Technical Traders Ltd. and the author of this report do not guarantee the accuracy, completeness, or usefulness of any content of this report, nor its fitness for any particular purpose. Lastly, the author does not guarantee that any of the companies mentioned in the reports will perform as expected, and any comparisons made to other companies may not be valid or come into effect.
Chris Vermeulen Archive |
© 2005-2022 http://www.MarketOracle.co.uk - The Market Oracle is a FREE Daily Financial Markets Analysis & Forecasting online publication.