


Stock Market Outlook: Why the Economy is Bullish for Stocks Going into 2019
Stock-Markets / Stock Markets 2018 Nov 17, 2018 - 10:09 PM GMTBy: Troy_Bombardia

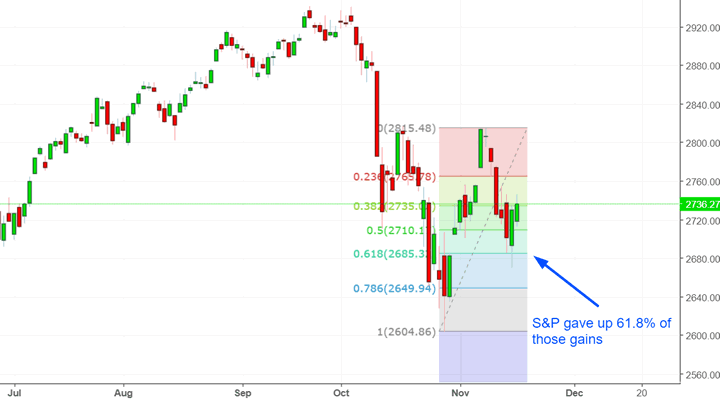
As we expected in last week’s market outlook, the U.S. stock market has pulled back after a hard bounce. The S&P 500 has now retraced more than 61.8% of its gains.
The economy’s fundamentals determine the stock market’s medium-long term outlook. Technicals determine the stock market’s short-medium term outlook. Here’s why:
- The stock market’s long term is bullish. The bull market will probably peak in Q2 2019.
- The stock market’s medium term is bullish (i.e. next 6-9 months).
- The stock market’s short term is mostly a 50-50 bet.
*At this point in the late-cycle bull market, the medium term & long term have become one and the same.
We focus on the medium and long term. Let’s go from the long term, to the medium term, to the short term.
Long Term
Our long term outlook remains bullish. This bull market will probably last until Q2 2019, after which a bear market will ensue. (This date is a moving target and will be adjusted as new data becomes available).
The economy and the stock market move in the same direction in the long term. Hence, leading economic indicators are also long term leading stock market indicators.
Most leading indicators are still improving. However, the economy is close to “as good as it gets”, which suggests that it’ll start to deteriorate in 2019.
Let’s look at the data.
Initial Claims is trending sideways while Continued Claims is trend downwards. Historically, these 2 data series trended upwards before bear markets and economic recessions began.
This is not a long term bearish sign for the stock market, but will be if Initial Claims & Continued Claims start to trend upwards in the first half of 2019. Initial Claims & Continued Claims are very low right now (historically speaking).
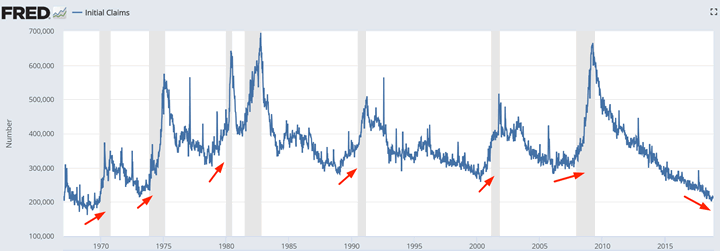
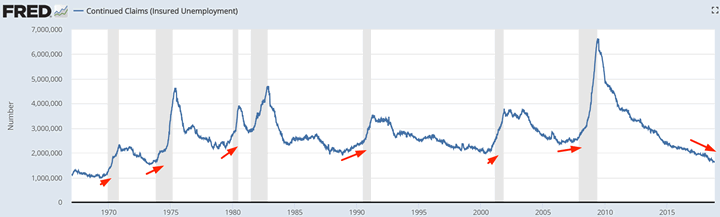
Source: FRED
Inflation-adjusted Retail Sales are still trending higher. Inflation-adjusted Retail Sales trended sideways before the last 2 recessions and equity bear markets.
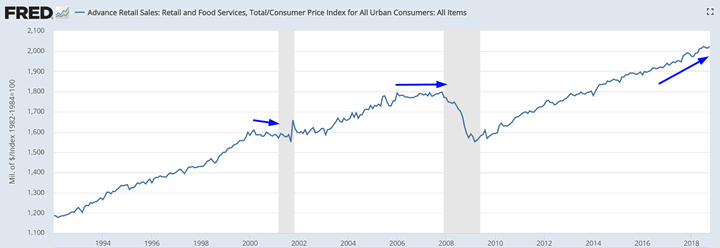
Source: FRED
It’s important to remember that the 10 year – 2 year yield curve has yet to invert. This yield curve inverted before prior recessions and bear markets. At this rate, the yield curve will probably invert after the Fed’s rate hike in December 2018.
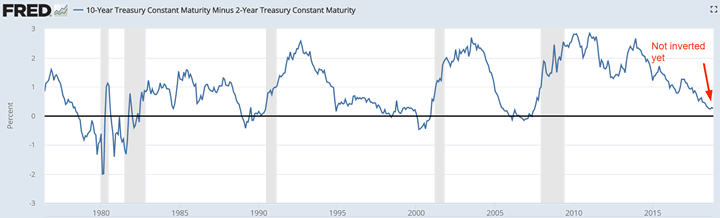
Source: FRED
Despite rising interest rates, financial conditions and banks’ lending standards are still relatively easy. In the past, financial conditions and lending standards trended upwards and were tighter before bear markets and recessions began.
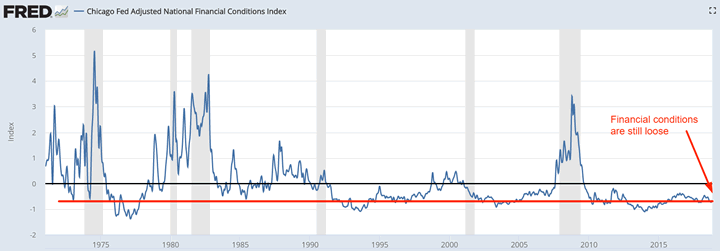
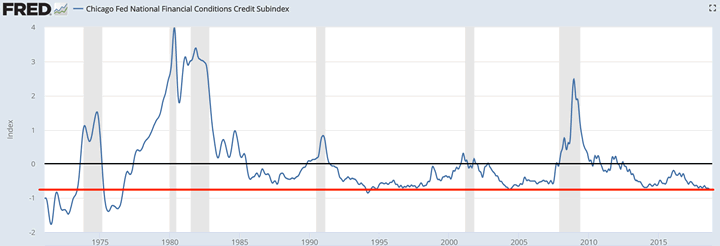
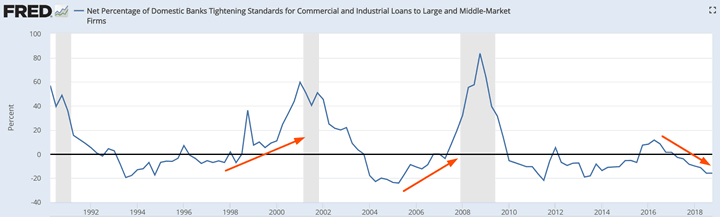
Source: FRED
And despite high levels of debt, delinquency rates are still going down. In the past, delinquency rates trended higher before bear markets and recessions began.
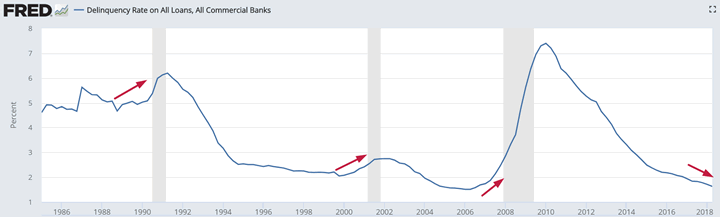
Source: FRED
Medium Term
Our medium term outlook (next 6-9 months) remains bullish.
*For reference, here’s the random probability of the U.S. stock market going up on any given day, week, or month.

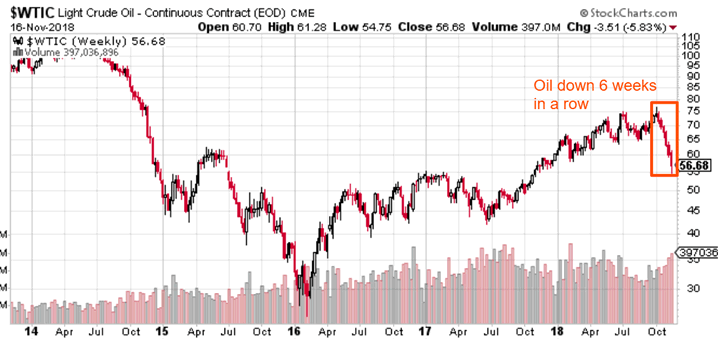
WTI oil has fallen 6 weeks in a row. As a result, some financial commentators are talking about “contagion” from oil to the U.S. stock market.
Is this likely?
Here’s what happens next to the S&P 500 when oil falls 6 weeks in a row
*Data from 1983 – present.
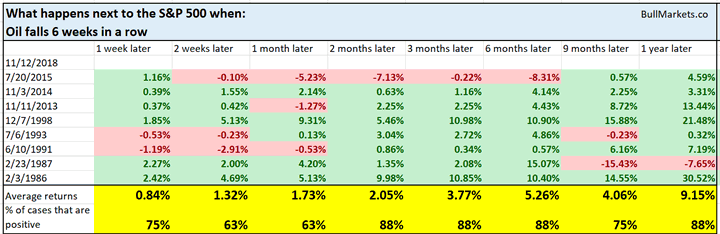
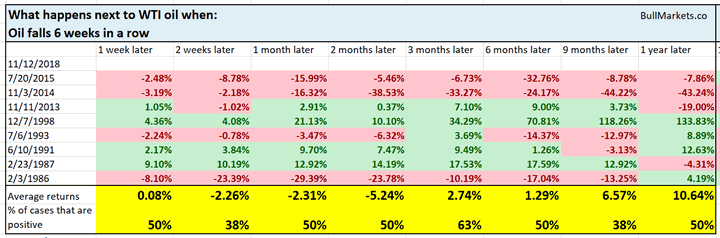
You can see that at the very least, this is not bearish for the U.S. stock market. Here’s what oil tends to do next after it falls 6 weeks in a row.
Meanwhile, the U.S. Dollar has gone up while oil has fallen. The U.S. Dollar Index is now up 5 weeks in a row.
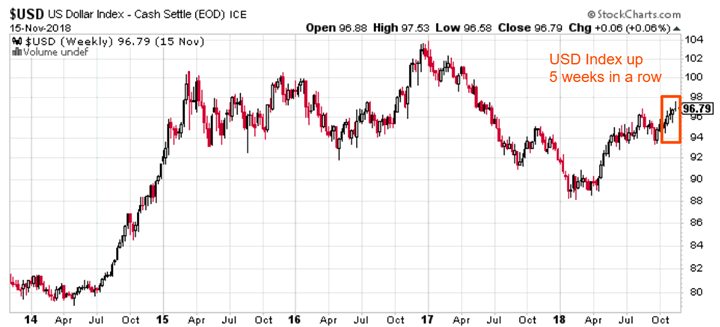
Is a rising U.S. dollar a “risk” for the U.S. stock market?
Here’s what the S&P 500 does next when the USD Index goes up 5 consecutive weeks.
*Data from 1974 – present
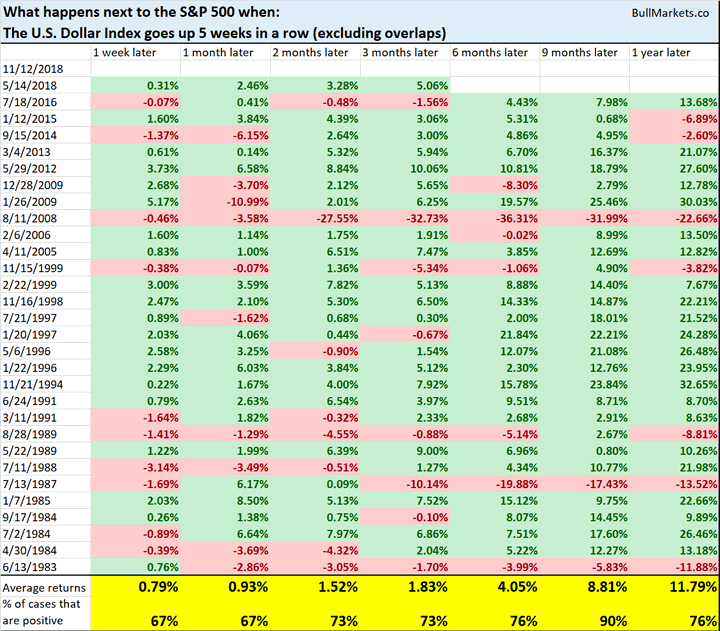
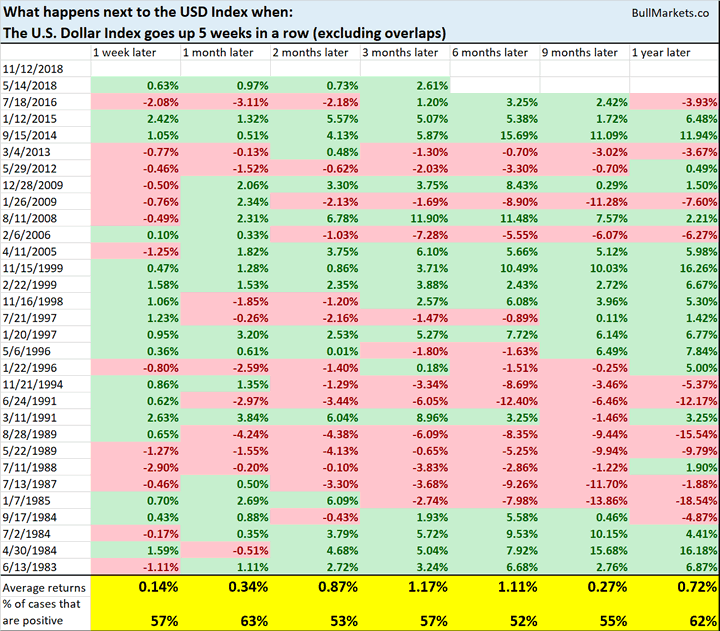
As you can see, a rising USD isn’t consistently bearish for the stock market on any time frame. Here’s what the USD Index tends to do next when it goes up 5 weeks in a row.
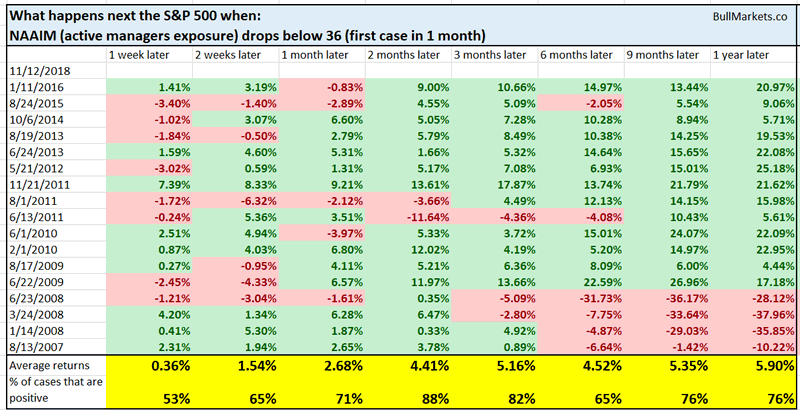
On Thursday, active managers’ exposure to U.S. equities became quite low.
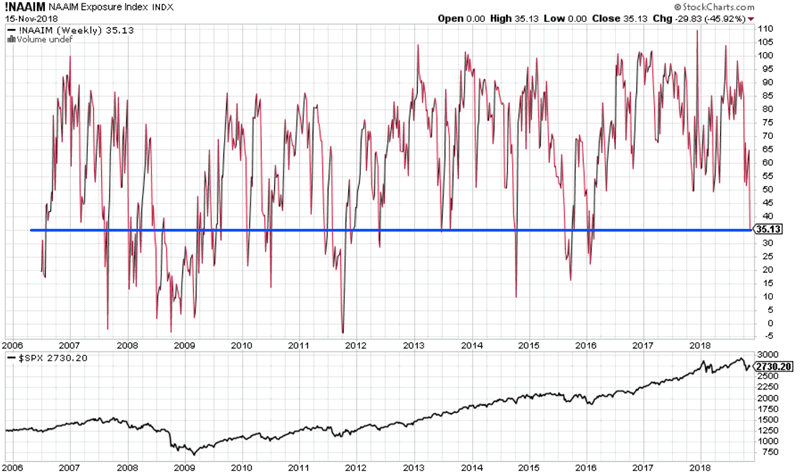
Source: StockCharts
When this happens, the stock market tends to bounce over the next 2-3 months:
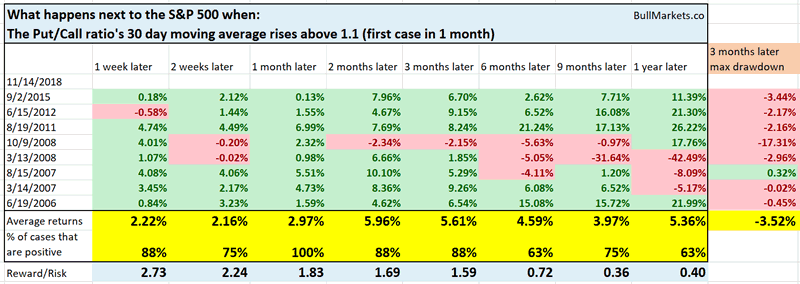
And on Thursday, the Put/Call ratio’s 30 day moving average exceeded 1.1. The Put/Call ratio is a sentiment indicator.
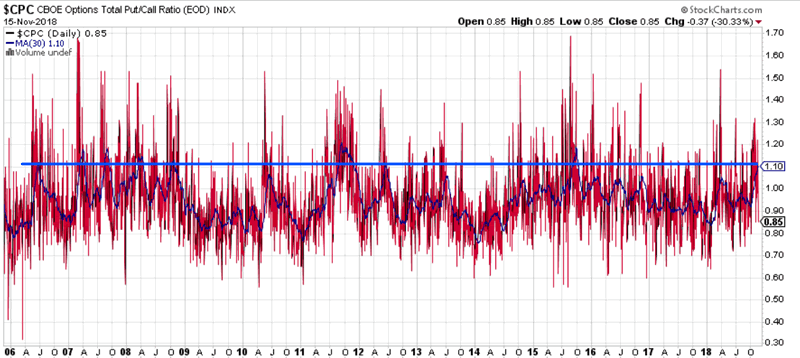
Source: StockCharts
Historically, this led to a bounce in the stock market over the next 1-3 months
What makes the stock market’s recent decline really interesting is that while the stock market has fallen, oil has fallen even more. (The decline in oil has partially contributed to small caps’ underperformance). This has caused the S&P:oil ratio to rise.
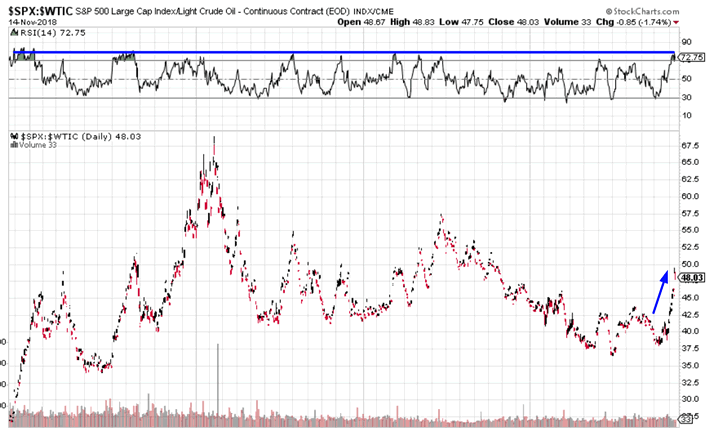
Source: StockCharts
Here’s what happens next to the S&P 500 when the S&P:oil ratio’s 14 day RSI exceeds 77
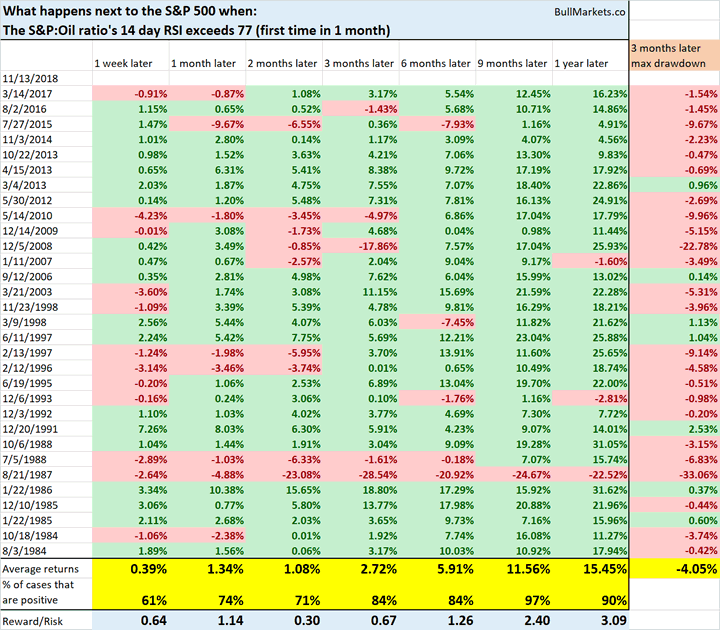
As you can see, the stock market tends to go up over the next 9 months.
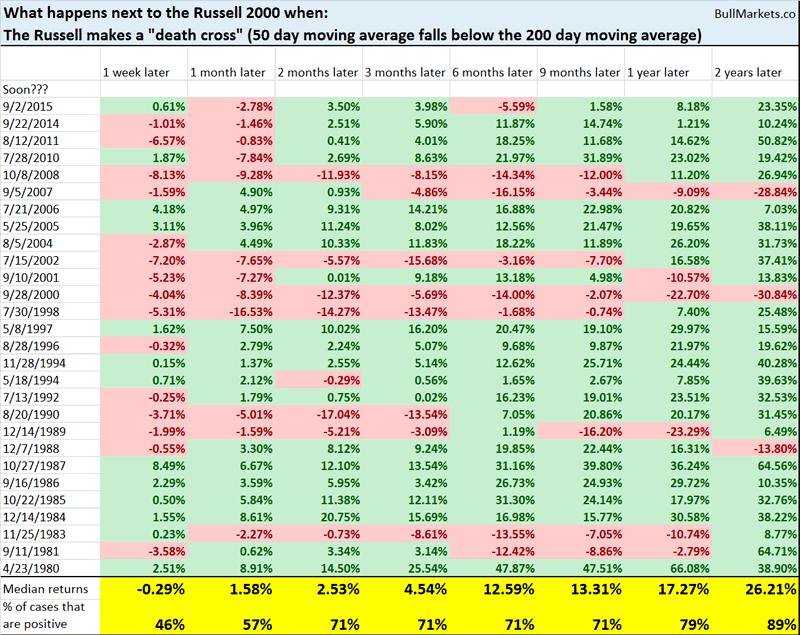
Russell 2000 (small caps index) has made a “death cross“, whereby its 50 day moving average crosses below its 200 day moving average.
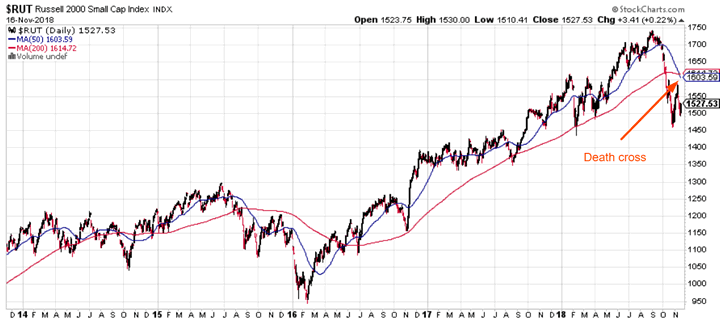
Contrary to popular belief, death crosses aren’t consistently bearish for the Russell in the medium term or long term.
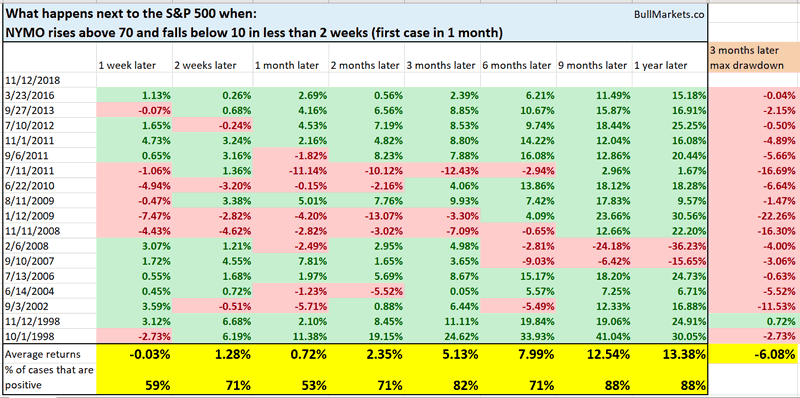
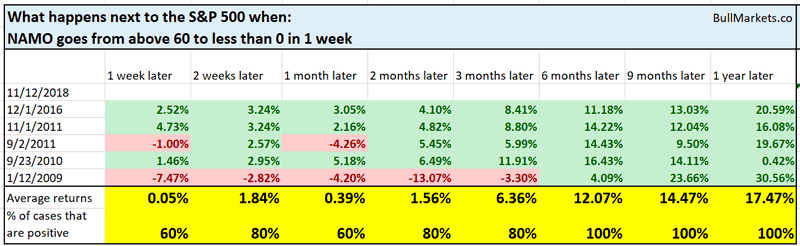
Both NYMO and NAMO (NYSE and NASDAQ’s McClellan Oscillator’s – breadth indicators), have reversed sharply downwards with the stock market’s decline this week.
Historically, such sharp pullbacks in NYMO and NAMO led to bounces for the stock market starting from 3 months later.
And lastly, here’s an interesting sign of late-cycle behavior.
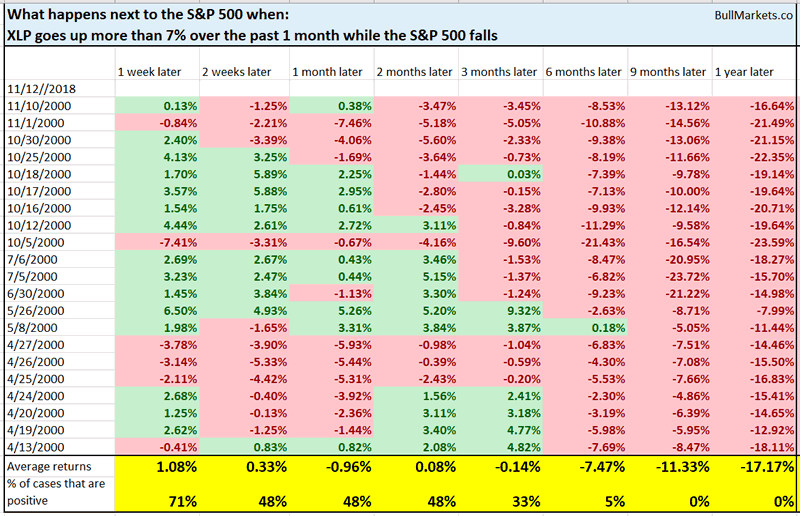
Throughout this correction, XLP has gone up while the S&P 500 has gone down. XLP is the consumer staples ETF – a defensive sector. This is uncommon. In a broad stock market decline, XLP tends to go down, but not as much as the S&P.
In the 1990s bull market, this first started to happen in April 2000. The stock market peaked 5 months later, and then a bear market ensued. Food for thought.
Short Term
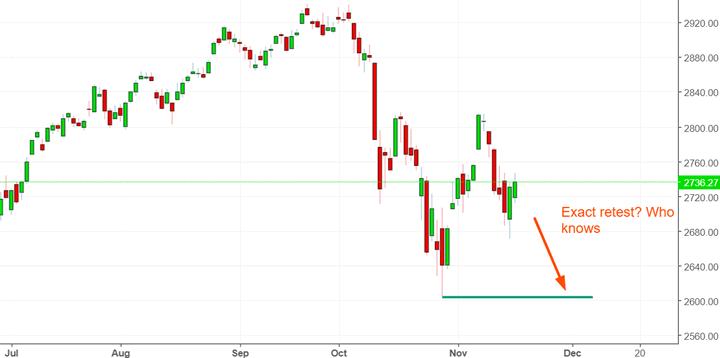
The stock market’s short term is a 50-50 bet right now. The stock market has already retraced 61.8% of its bounce, and no one really knows if the S&P will make an exact retest of the October lows or not.
Short term probability doesn’t favor bulls or bears right now. The short term is little more than a 50-50 bet in most cases anyways.
Click here to read last week’s discretionary market outlook.
Conclusion
Here is our discretionary market outlook:
- The stock market’s long term is bullish. The bull market will probably peak in mid-2019, after which a bear market will ensue.
- The stock market’s medium term is bullish (i.e. trend for the next 6-9 months).
- The stock market’s short term is mostly a 50-50 bet right now.
Focus on the medium term and the long term.
Our discretionary outlook is usually, but not always, a reflection of how we’re trading the markets right now. We trade based on our clear, quantitative trading models, such as the Medium-Long Term Model.
Members can see exactly how we’re trading the U.S. stock market right now based on our trading models.
Click here for more market studies
By Troy Bombardia
I’m Troy Bombardia, the author behind BullMarkets.co. I used to run a hedge fund, but closed it due to a major health scare. I am now enjoying life and simply investing/trading my own account. I focus on long term performance and ignore short term performance.
Copyright 2018 © Troy Bombardia - All Rights Reserved
Disclaimer: The above is a matter of opinion provided for general information purposes only and is not intended as investment advice. Information and analysis above are derived from sources and utilising methods believed to be reliable, but we cannot accept responsibility for any losses you may incur as a result of this analysis. Individuals should consult with their personal financial advisors.
© 2005-2022 http://www.MarketOracle.co.uk - The Market Oracle is a FREE Daily Financial Markets Analysis & Forecasting online publication.