


ETF's Hit Harder by Credit Crisis Volatility than Indices - Yorba TV Show
Stock-Markets / Exchange Traded Funds Sep 23, 2008 - 10:53 AM GMT

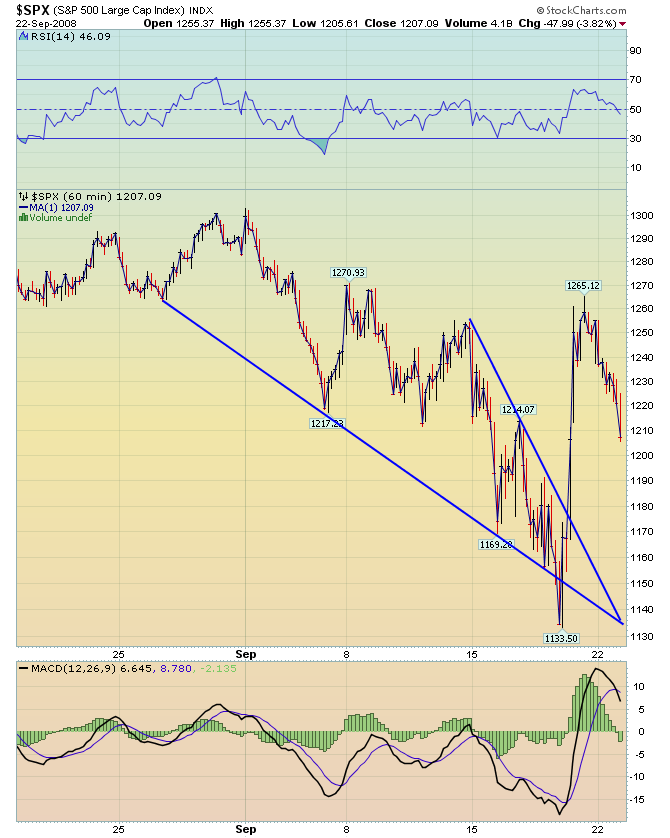
 Last week was one of the most volatile weeks seen since 1987. On Tuesday's show I warned that it was not a good place to go short, since my model suggested a rally by the end of the week. A look at the chart showed a bullish wedge being formed (see the chart). Usually a bullish wedge will retrace its total decline, which means that it may still rally up to 1300 to 1320. However, I would not put my hopes too high on that possibility. The move after that should be much more bearish.
How that rally came about was one of the most fascinating power plays I have ever seen put on by Wall Street and its cronies in Washington. It took $180 billion cobbled together by the world central banks and an overnight change in the rules of the game to rescue itself from some staggering losses. Just to make sure the rally would stick, they halted all short selling of financial shares. The Short Financial ETF (SEF) was down from $81.50 to $60.05…a drop of 26.3% in a single day. The ultra-short Financial ETF (SKF) went down from 154.77 per share to 87.00 …a 56% drop in a single day. Trading of those ETFs was halted on Friday, after those huge losses to investors.
On Monday, shorting restrictions were expanded to companies such as GE, American Express and GM, since these companies are also being hit by the financial fallout. For those traders using ETFs, this has led to unforeseen consequences that we should address here. The ability of certain ETFs to deliver the goods is now being impacted. Let's take yesterday's market and figure out how efficient certain ETFs are after the ban on short selling of financial stocks was expanded.
The first ETF to examine is the SPY. The Spider lost 2.26% on Monday while the SPX was down 3.82% That amounts to slippage of 41% on the long shares. The single-short ETF (SH) was up 3.16%, which gives it an efficiency rating of 79.6%. However, the double-short ETF (SDS) was only up 3.17%, which gives it an efficiency rating of 39.9%. It appears that the single short ETF has not lost much of its efficiency, while the double short ETF should probably be avoided, due to the higher volatility and poor efficiency. This is only a one-day result, so once the rules become better understood, the efficiency may rise.
The DJIA, however, lost its largest exposure to the financials when AIG dropped off the list of 30 companies and was replaced by a non-financial company. As of Monday, DIA had an 82.5% efficiency and DOG delivered an 85.2% efficiency. In the Ultra-long and short category, DDM has a 96.5% efficiency and the DXD has a 79.7% efficiency.
In the NDX, both the short ETF (PSQ) gave us a 65.7% efficiency rating, while the ultra-short ETF (QID) gave us a 68.5% efficiency rating.
Finally in the RUT, the single short ETF (RWM) gave traders an 81.4% efficiency while the ultra-short ETF (TWM) delivered an 85.4% efficiency.
My conclusion? Whether it is liquidity concerns or shorting restrictions, some ETFs are delivering the goods more efficiently than others. This is strictly a non-scientific observation, so let's see in another week how these efficiencies stand up.
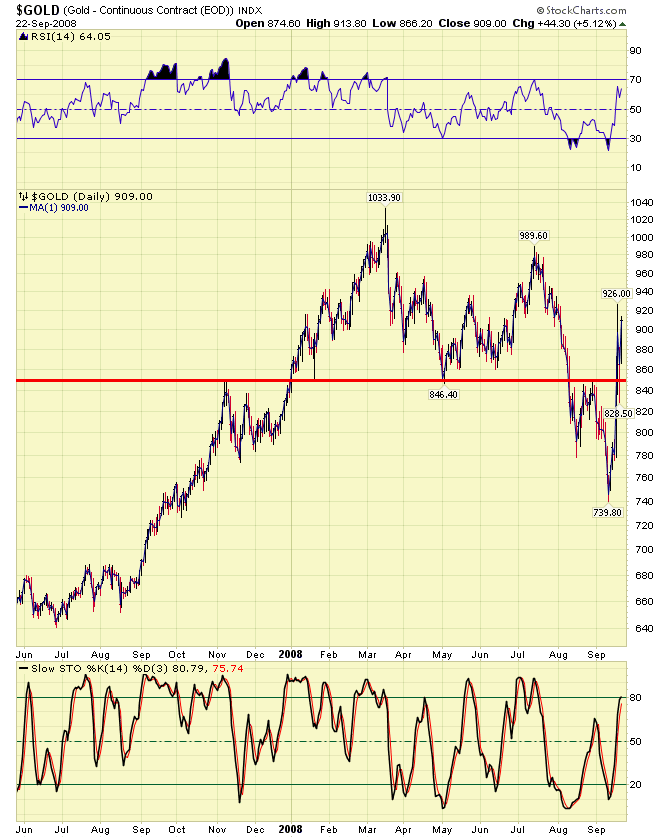
I must admit that I was wrong on gold last week, but I also gave a warning that if gold were to go above 805, I would change my view to bullish. Today I am still bullish, with a couple of warnings. The first is that stiff resistance is at 985, just below the July high and even stiffer resistance is at 1000. It happens that if this is a zig zag pattern, wave A = C at 1000, so I am willing to stick my neck out and suggest that 1000 would be an excellent target for gold.
See you at 3:00 CST.
Which will it be? Stay tuned! on www.yorba.tv every Tuesday at 4:00 pm EDT . You can find the archives of my latest programs by clicking here . Please make an appointment to discuss our investment strategies by calling Claire or Tony at (517) 699-1554, ext 10 or 11. Or e-mail us at tpi@thepracticalinvestor.com .
Anthony M. Cherniawski,
President and CIO
http://www.thepracticalinvestor.com
As a State Registered Investment Advisor, The Practical Investor (TPI) manages private client investment portfolios using a proprietary investment strategy created by Chief Investment Officer Tony Cherniawski. Throughout 2000-01, when many investors felt the pain of double digit market losses, TPI successfully navigated the choppy investment waters, creating a profit for our private investment clients. With a focus on preserving assets and capitalizing on opportunities, TPI clients benefited greatly from the TPI strategies, allowing them to stay on track with their life goals
Disclaimer: The content in this article is written for educational and informational purposes only. There is no offer or recommendation to buy or sell any security and no information contained here should be interpreted or construed as investment advice. Do you own due diligence as the information in this article is the opinion of Anthony M. Cherniawski and subject to change without notice.
Anthony M. Cherniawski Archive |
© 2005-2022 http://www.MarketOracle.co.uk - The Market Oracle is a FREE Daily Financial Markets Analysis & Forecasting online publication.