


Why Is Central Bank Buying Of Gold So Important?
Commodities / Gold & Silver 2019 Feb 21, 2019 - 09:03 AM GMTBy: Avi_Gilburt

 There is an old Yiddish expression called a bubbe meise (pronounced my-seh). I guess the closest English interpretation of this expression would be a grandmother’s tale, or in the common vernacular, an old-wives' tale.
Of late, I am seeing a bubbe meise about the importance of central bank buying of gold, and it is making its rounds on websites all over the internet.
We have been hearing for many years about how gold is supposed to soar because countries and central banks are buying the precious metal. Most of the fundamentalists in this market are convinced that this is a bullish signal. In fact, one article I read explained that central bank buying “is significant, as central banks are the 'smart money' given their influence on global economics and access to non-public information.”
And, all I can think is that this writer does not know their history.
All we heard between 2011 to 2014 was how bullish the gold market was because China and India were buying huge amounts of gold. Yet, gold topped at the time when central banks began their huge buying spree in 2011 and continued down for years during this buying spree. “Smart money” indeed.
So, unfortunately, the facts do not support the commonly accepted proposition which seems to be making the rounds. In fact, historically, it is more common to see countries selling their gold at the bottom rather than buying.
From 1999-2002, Great Britain sold about half of its gold reserves. But guess what happened after the sales? Yes, gold began its parabolic climb from just below $300 an ounce to over $1,900 within nine years. In fact, that bottom in gold became dubbed the "Brown Bottom," named after Gordon Brown, the U.K. chancellor of the exchequer, who made the decision to sell the gold at that time.
You see, governments are usually the last actors within a sentiment trend. Think about it. Aren't governments enacting new laws to protect investors at the end of bear markets — after all the damage has already been done? So, it is not unreasonable to believe that governments would be the last sellers to the market to conclude a bear market. Moreover, it is common to see them as buyers when markets are near some form of high, such as they seem to have done during 2011-2014. And this is why I was awaiting news of a government selling its gold reserves to represent the culmination of a selling trend several years ago.
Back in 2015, I read an article noting that Venezuela could be selling more than 3 million ounces of gold reserves before year-end. The country had more than $5 billion in maturing debt and interest payments due before year-end without the ability to repay it.
While the 12 million ounces of gold sold by Great Britain at the "Brown Bottom" is clearly more than the 3 million ounces that Venezuela was considering selling, recognize that Great Britain's proceeds from its sale were estimated at around $3.4 billion, whereas the Venezuela sale would have likely netted around $3 billion.
Additionally, back in 2015, the major players within the gold market turned bearish. At September's Denver Gold Forum in 2015, a panel of gold-industry experts came to a consensus that gold is still overvalued and would likely fall below $1,000, perhaps to around $800. Moreover, at the LBMA/LPPM gold conference in Vienna, an expert panel discussion on gold came up with almost an identical consensus. The panel also expected that gold will drop to below $1,000, and perhaps to $800 or less.
Again, more “smart money?”
In fact, based upon the sentiment exhibited in the media, as well as in my charts, I noted at the time:
These recent events somewhat bolster my argument that the bottom to this market may be closer than most believe, and it may not drop as deep as many believe. As the next, and final, decline takes hold, we will be able to pinpoint the target more accurately. But I have been having strong doubts about whether gold will actually break below $1,000 with so many believing it is almost a certainty. Remember what happened back in 2011 when almost everyone (other than yours truly) believed that it was a virtual certainty that gold was going to exceed $2,000? As the late Yogi Berra would say, this might be "deja vu all over again."
And, in the last quarter of 2015, we rolled out a Miners Portfolio service at Elliottwavetrader.net, and started buying mining stocks for the first time since 2011. In fact, one of our first purchases was Barrick Gold (NYSE:GOLD) when ABX was in the $7 region. A little over 3 years later, and even after a multi-year correction in the complex, the stock is still up 85% and poised to run higher. How many stocks do you know of which have been up 85% in the last 3 years, even after a multi-year pullback?
I was also on the phone with Doug Eberhardt the night that gold hit its final lows putting in my final buying order, as I expected we were hitting the bottom that night. To this end, Doug actually posted:
I can attest to your accuracy on actually buying both gold and silver from us as close to the bottom as one could.
Then, in January of 2016, it was announced that Venezuela sent $1.3 billion worth of gold bars to Switzerland, according to data from the Swiss Federal Customs Administration. In fact, it seems that the Central Bank of Venezuela had reduced its gold holdings in 2015 by 25%, and this is even before hearing about this transfer in 2016. Again, are we supposed to believe this is “smart money” action?
To add to this bottoming evidence, in early 2016, it became known that the Bank of Canada sold all the rest of its gold. Yes, you heard that right. Clearly, we have more evidence of “smart money” activity! At the time, I noted that “I would consider this akin to the "Brown Bottom" which marked the bottoming of gold back in 2002.” I further noted that “while 2002 became known as the "Brown Bottom," 2016 may yet become known as the "Maple Leaf Low."
So, I am going to let you in on a little secret at this time. If you want to know what is going to happen in the metals complex, it is not the central banks buying you want to watch. Right now, I would be watching Newmont Mining (NYSE:NEM) very closely. As long as it remains below 34.29, it still has potential to strike lower lows below those seen in 2018. However, should you see it break out over that level, it will confirm for me that a bottom has been struck, and we are on the verge of a strong rally about to take hold in the complex.
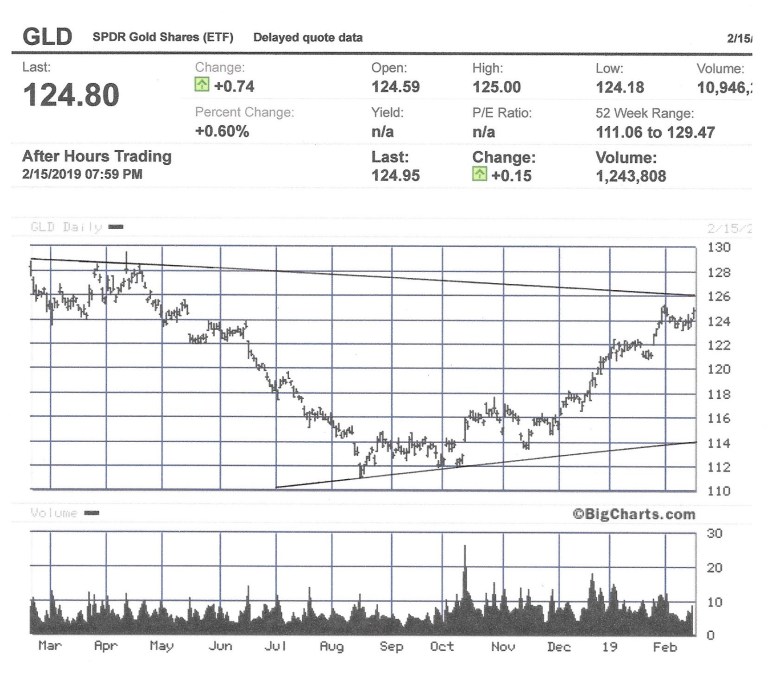
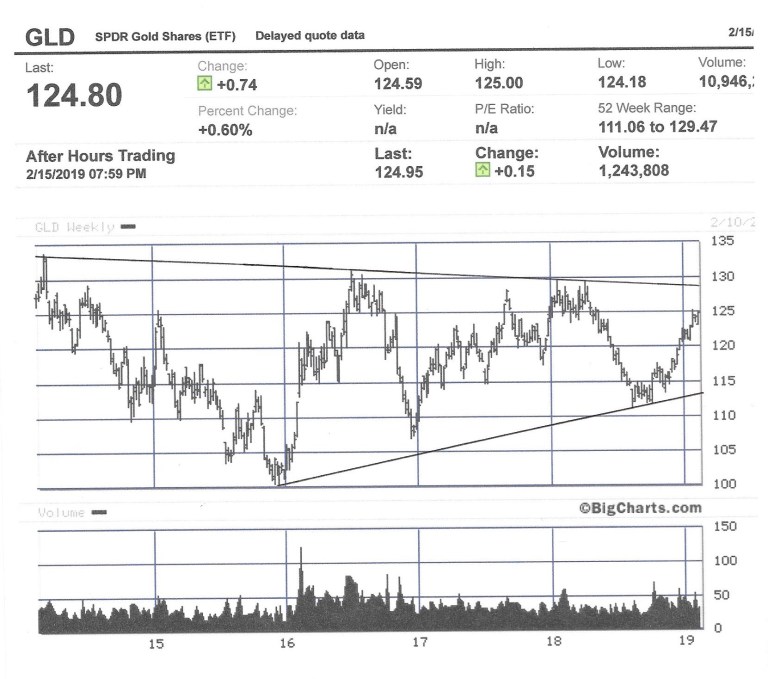
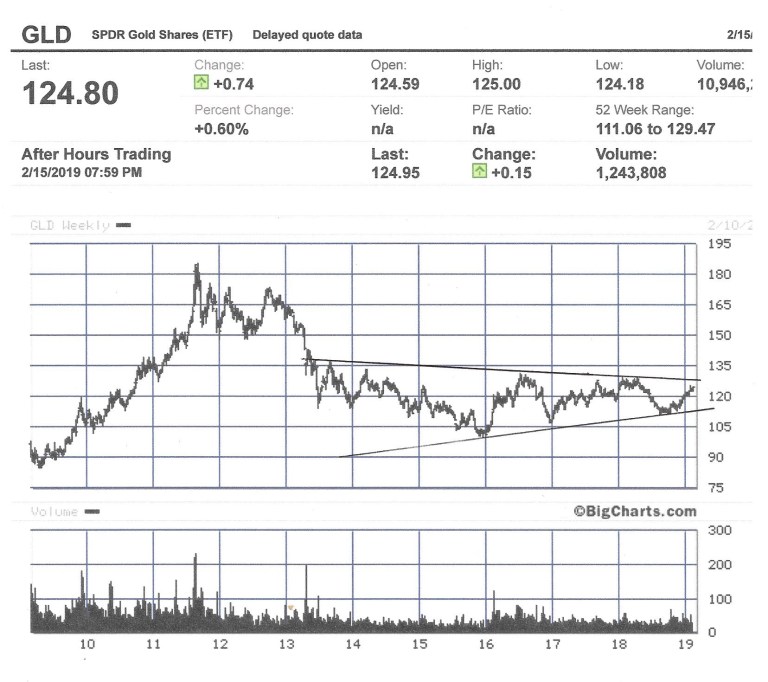
See charts and additional detail on NEM as well as the GDX, GLD & Silver.
Avi Gilburt is a widely followed Elliott Wave technical analyst and author of ElliottWaveTrader.net (www.elliottwavetrader.net), a live Trading Room featuring his intraday market analysis (including emini S&P 500, metals, oil, USD & VXX), interactive member-analyst forum, and detailed library of Elliott Wave education.
© 2019 Copyright Avi Gilburt - All Rights Reserved Disclaimer: The above is a matter of opinion provided for general information purposes only and is not intended as investment advice. Information and analysis above are derived from sources and utilising methods believed to be reliable, but we cannot accept responsibility for any losses you may incur as a result of this analysis. Individuals should consult with their personal financial advisors.
Gold Technical Perspective – Why So Bullish?
Does technical analysis need to be so convoluted? Here are a couple of definitions from different sources:
1) Convoluted: (especially of an argument, story, or sentence) extremely complex and difficult to follow. (source)
2) Convoluted sentences, explanations, arguments, etc. are unreasonably long and difficult to understand.
1) Extrapolation: the action of estimating or concluding something by assuming that existing trends will continue or a current method will remain applicable.
Kelsey Williams is the author of two books: INFLATION, WHAT IT IS, WHAT IT ISN’T, AND WHO’S RESPONSIBLE FOR IT and ALL HAIL THE FED!
By Kelsey Williams
http://www.kelseywilliamsgold.com
Kelsey Williams is a retired financial professional living in Southern Utah. His website, Kelsey’s Gold Facts, contains self-authored articles written for the purpose of educating others about Gold within an historical context.
© 2019 Copyright Kelsey Williams - All Rights Reserved Disclaimer: The above is a matter of opinion provided for general information purposes only and is not intended as investment advice. Information and analysis above are derived from sources and utilising methods believed to be reliable, but we cannot accept responsibility for any losses you may incur as a result of this analysis. Individuals should consult with their personal financial advisors.
© 2005-2022 http://www.MarketOracle.co.uk - The Market Oracle is a FREE Daily Financial Markets Analysis & Forecasting online publication.