


Slowing Stock Market Rally, What's Next
Stock-Markets / Stock Markets 2019 Feb 27, 2019 - 03:39 PM GMTBy: Troy_Bombardia

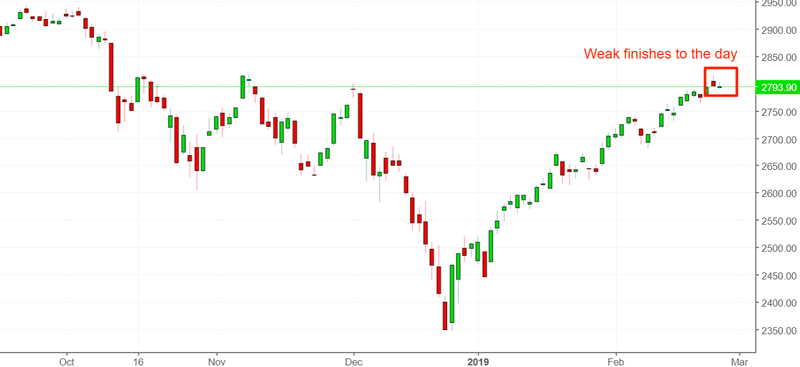
 For the first time since the stock market’s bottom in December 2018, the S&P has closed in the bottom 1/3 of its daily range for 2 consecutive days. In other words, the stock market’s rally is slowing down.
Meanwhile, the housing market continues to deteriorate. Housing is a key leading indicator for the economy and stock market.
Go here to understand our fundamentals-driven long term outlook.
Let’s determine the stock market’s most probable medium term direction by objectively quantifying technical analysis. For reference, here’s the random probability of the U.S. stock market going up on any given day.

*Probability ≠ certainty. Past performance ≠ future performance. But if you don’t use the past as a guide, you are blindly “guessing” the future.
High Consumer Confidence
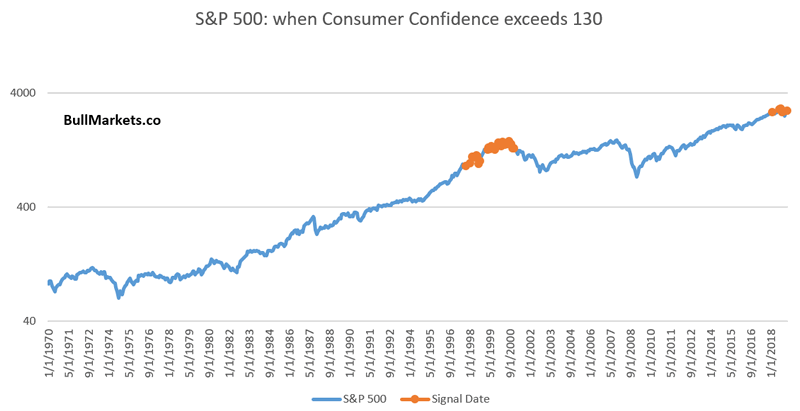
The Conference Board’s Consumer Confidence Index remains extremely high, and is above 130 right now.
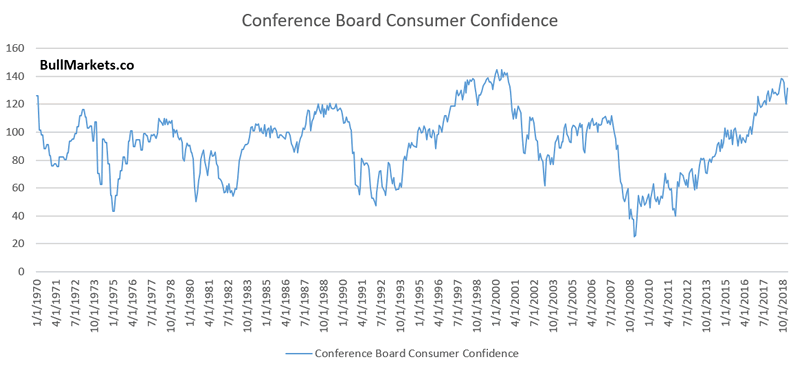
While this is a normal late-cycle sign for the bull market and economic expansion, it is not an immediately long term bearish sign.
- Consumer Confidence can stay elevated for a long time. I.e. this happened from 1997 – 2000
- “High” Consumer Confidence can become even higher. For example, Consumer Confidence consistently peaked at 120 from 1970 – 1995. But from 1996-2000, Consumer Confidence made new highs. There is no such thing as “too high”
Housing Starts
The latest reading for Housing Starts fell from its previous reading. 2018 saw the largest decline in Housing Starts since the beginning of this economic expansion.
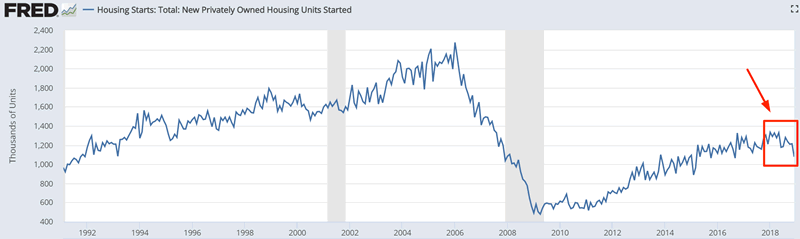
Here’s what happens next to the S&P when Housing Starts falls more than -19% over the past 11 months
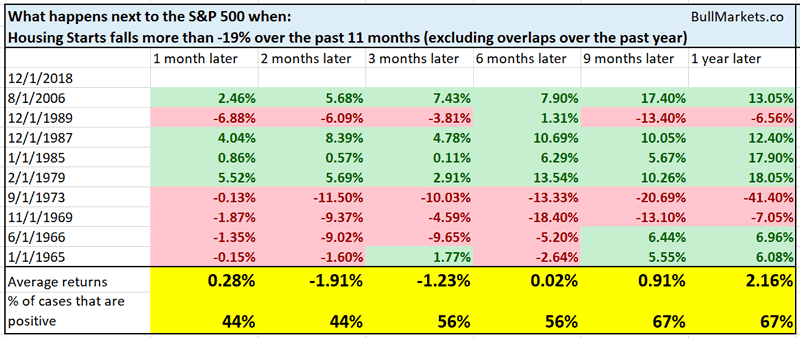
As you can see, the stock market’s forward returns are slightly less bullish than random. Not an immediately long term bearish sign for the stock market, but something to watch out for IF the weakness in housing persists over the next few months.
Existing Home Sales
Like Housing Starts, Existing Home Sales has fallen significantly recently.
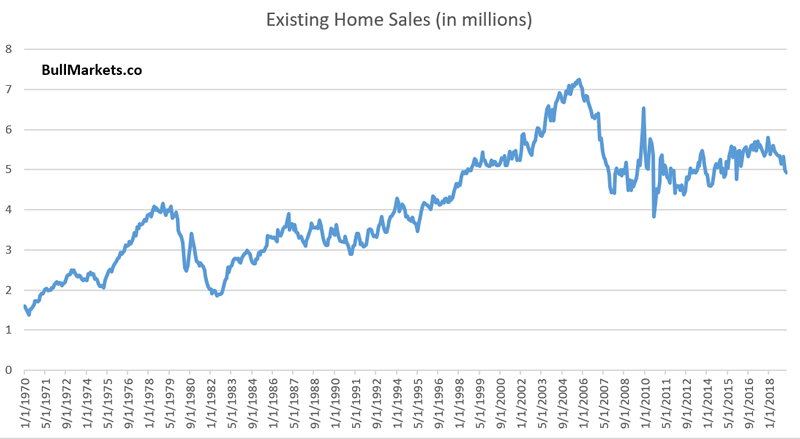
Here’s what happens next to the S&P when Existing Home Sales falls more than -15% from a 2 year high.
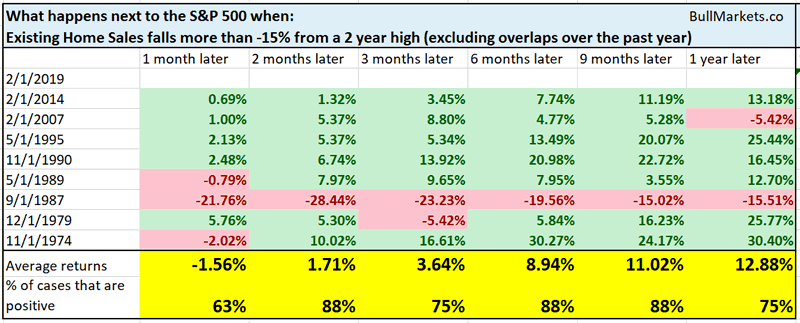
This is more bullish than bearish for the S&P 6-9 months later. Why?
Because housing is a leading indicator. Weakness tends to occur 1 year before a bear market or recession begins. This is something to watch out for in 2020.
Yield Curve
While the stock market rallied significantly, the yield curve has flattened.
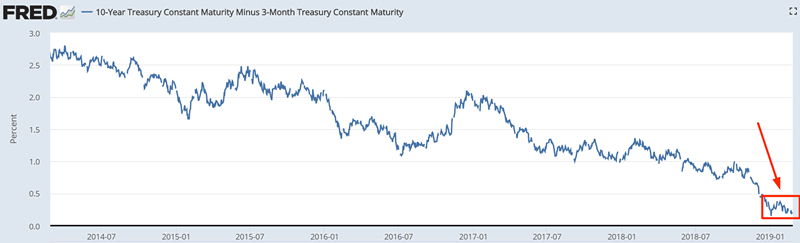
This is important because:
- 15%+ stock market rallies accompanied by steepening yield curves are usually bear market rallies
- 15%+ stock market rallies accompanied by flattening yield curves are usually bull market rallies.
Here’s what happens next to the S&P when the yield curve flattens more than 10 basis points while the S&P rallies more than 15% over the past 2 months
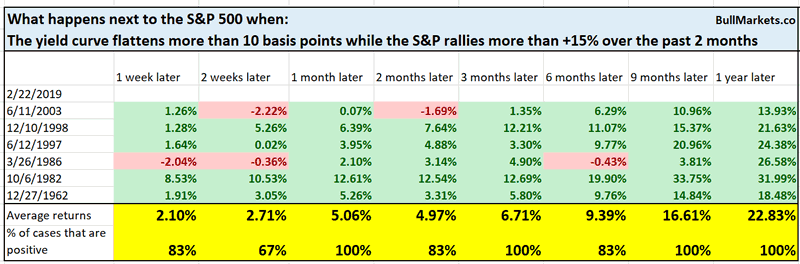
This is bullish for stocks on almost every time frame.
12 month rate-of-change
The S&P’s 12 month rate-of-change is about to turn positive.
Here’s what happens next to the S&P when its 12 month rate-of-change goes from under -5% to above 0%
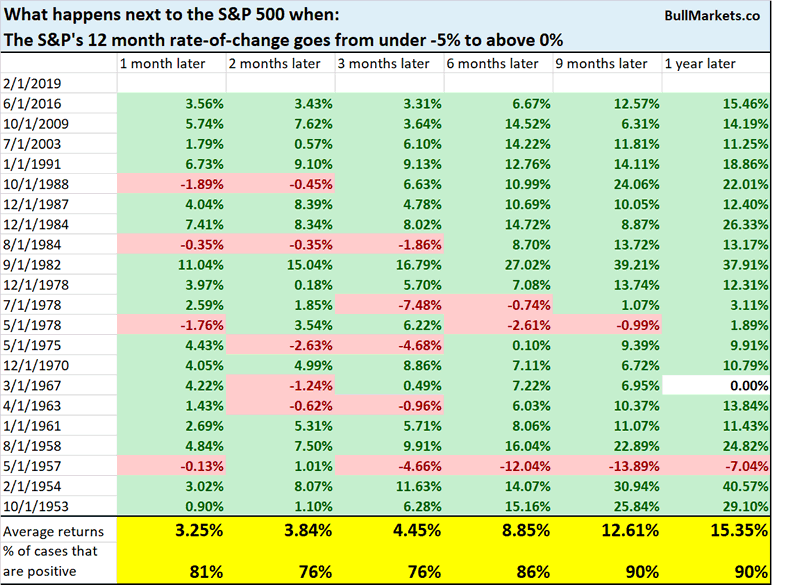
This is a bullish factor for stocks 9-12 months later.
Sustained breakout
The S&P 500’s breakout above its 200 dma has been sustained. The S&P has not gone back-and-forth around its 200 dma.
Here’s what happens next to the S&P when it closes above its 200 dma for 10 consecutive days, after being more than -10% below its 200 dma sometime within the past 3 months
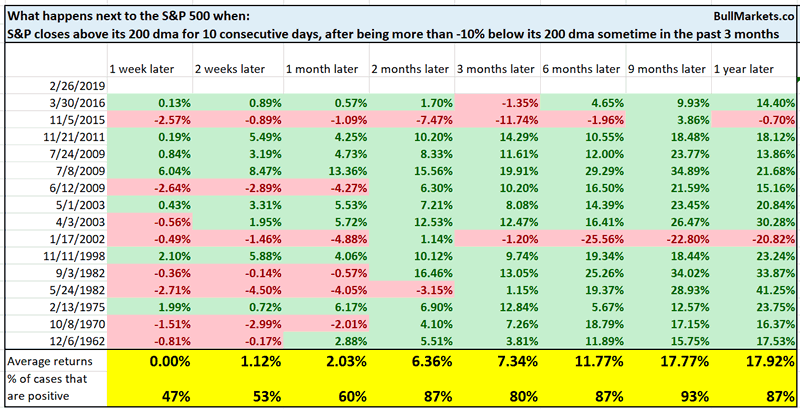
Once again, this is a bullish factor for stocks 6-12 months later.
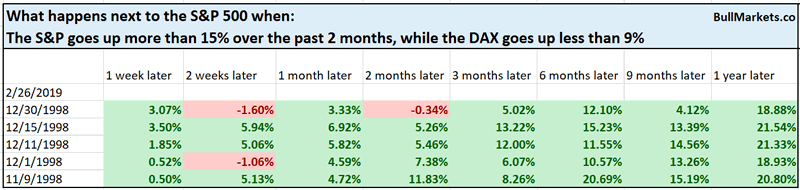
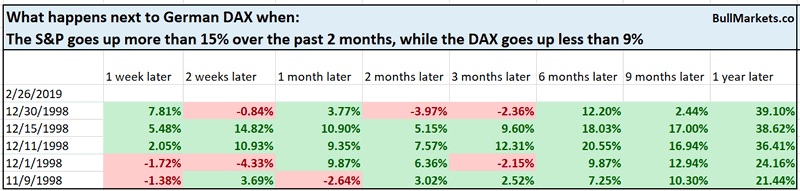
German Dax
I follow the German DAX sporadically. The DAX moves inline with the S&P 500 most of the time.
The DAX, like all ex-U.S. stock markets, was much weaker than the U.S. stock market in 2018. One would assume that with the U.S. stock market rallying, the DAX would rally significantly as well.
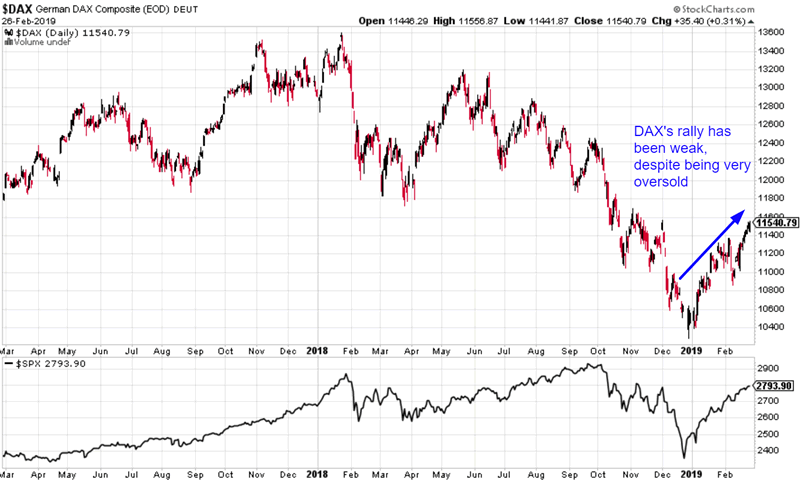
Instead, the DAX’s rally has been weak in the face of such a strong S&P rally.
From 1990 – present, there has only been 1 other case in which the S&P rallied more than 15% over the past 2 months, while the DAX rallied less than 9%.
Day vs. Night
2019 has thusfar been remarkably different from 2018.
- Most of the S&P’s gains in 2019 have occurred during the day
- All of the S&P’s gains in 2018 occurred at night
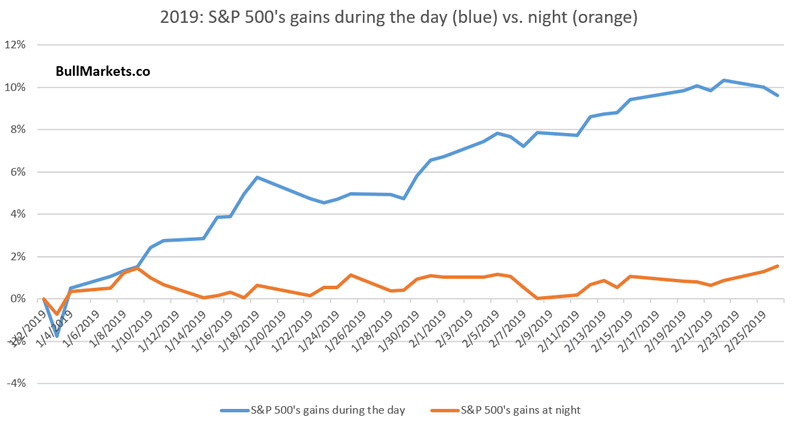
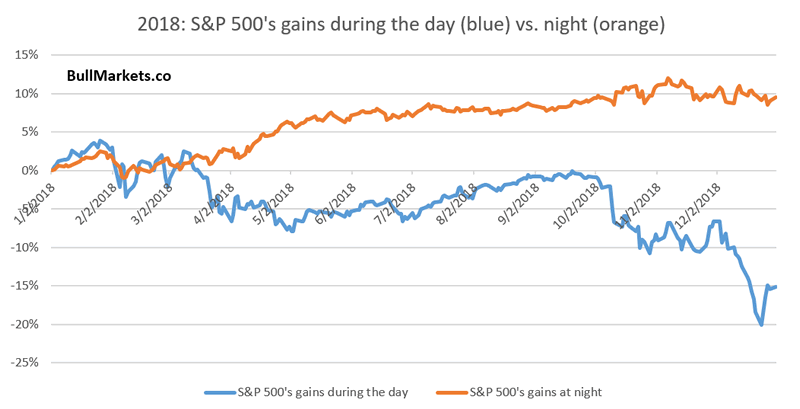
Many traders treat this as a bullish sign for stocks. They believe that the “smart money” trades during the day while the “dumb money” trades at night. Personally, I have found this distinction to not always be accurate.
Here’s what happens next to the S&P when it rallied more than 15% over the past 42 days, while it fell over the past 42 nights.
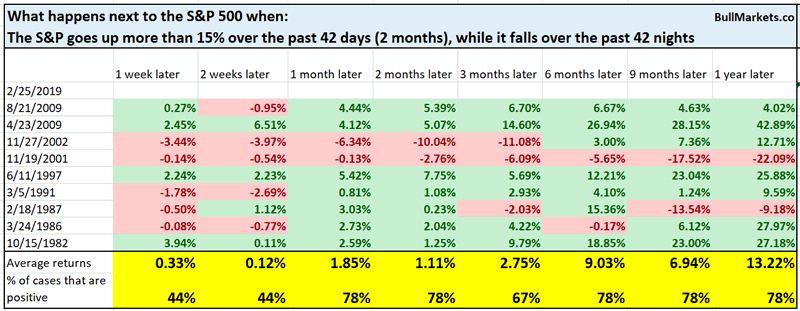
Not consistently bullish or bearish for stocks.
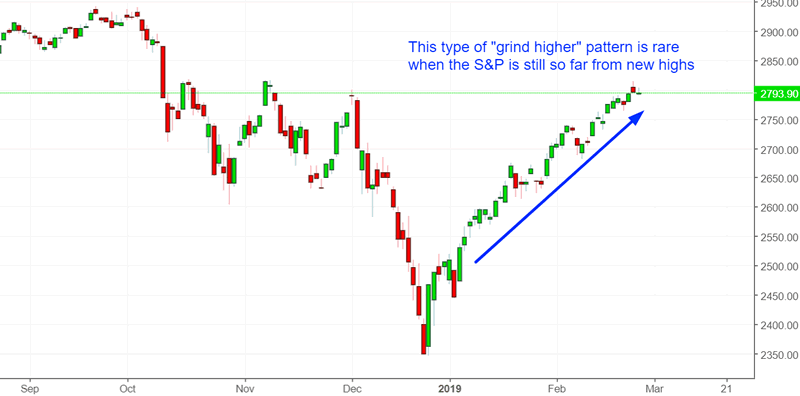
Rare and persistent
The stock market’s rally has been extremely persistent. It has gone up 30 of the past 42 days. This type of “grind higher” behavior is more common when the stock market is making new highs. It is much less common when the S&P is still below its all-time high.
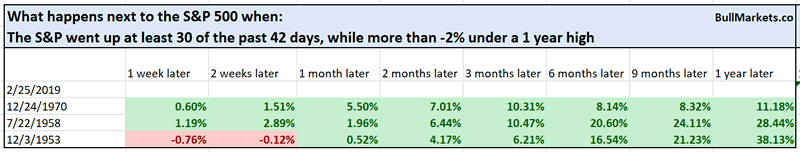
Click here for yesterday’s market study
Conclusion
Here is our discretionary market outlook:
- The U.S. stock market’s long term risk:reward is no longer bullish. In a most optimstic scenario, the bull market probably has 1 year left. Long term risk:reward is more important than trying to predict exact tops and bottoms.
- The medium term direction (e.g. next 6-9 months) is more bullish than bearish.
- The stock market’s short term has a bearish lean due to the large probability of a pullback/retest. Focus on the medium-long term (and especially the long term) because the short term is extremely hard to predict.
Our discretionary outlook is not a reflection of how we’re trading the markets right now. We trade based on our clear, quantitative trading models, such as the Medium-Long Term Model.
Members can see exactly how we’re trading the U.S. stock market right now based on our trading models.
Click here for more market studies
By Troy Bombardia
I’m Troy Bombardia, the author behind BullMarkets.co. I used to run a hedge fund, but closed it due to a major health scare. I am now enjoying life and simply investing/trading my own account. I focus on long term performance and ignore short term performance.
Copyright 2019 © Troy Bombardia - All Rights Reserved
Disclaimer: The above is a matter of opinion provided for general information purposes only and is not intended as investment advice. Information and analysis above are derived from sources and utilising methods believed to be reliable, but we cannot accept responsibility for any losses you may incur as a result of this analysis. Individuals should consult with their personal financial advisors.
© 2005-2022 http://www.MarketOracle.co.uk - The Market Oracle is a FREE Daily Financial Markets Analysis & Forecasting online publication.