


Looking at the Economic Winter Season Ahead
Economics / Recession 2019 Mar 19, 2019 - 04:24 PM GMTBy: Harry_Dent

 Last Friday I talked about how we have been in a muted Economic Winter Season. We may have had the greatest stock market bubble ever, but our economic “recovery” has been the weakest on record, despite the strongest, globally-concerted stimulus ever.
Here’s a chart comparing the real GDP for the 11 years from the 1929 top through the 1940 bottom to the 11 years from 2007 to 2018.
Notice how the cumulative GDP growth since 2007 is 19%? It was 20% from 1929 through 1940. That means this period has actually been slightly worse.
How could this be?
The clear difference is that the Great Depression started with the greatest crash in U.S. history, with stocks down 89%, 25% unemployment, and a GDP fall of 30% between 1929 and 1933.
Think of it like the Big Bang. The explosion came at the beginning and everything took shape from there.
The current Economic Winter Season also started with a stock crash and high unemployment: 54% loss in the markets, near 11% unemployment, and a GDP fall of 4.3%.
Mild in comparison…
But the recovery from 1933 to 1937 saw average real GDP growth of a whopping 9% per year. We’ve managed to eke out just 2% per year. Then there was a less severe crash and mini-depression or great recession in 1938 that lingered into 1942. Stocks bottomed in 1942 and the next great long-term bull market began.
What does this mean?
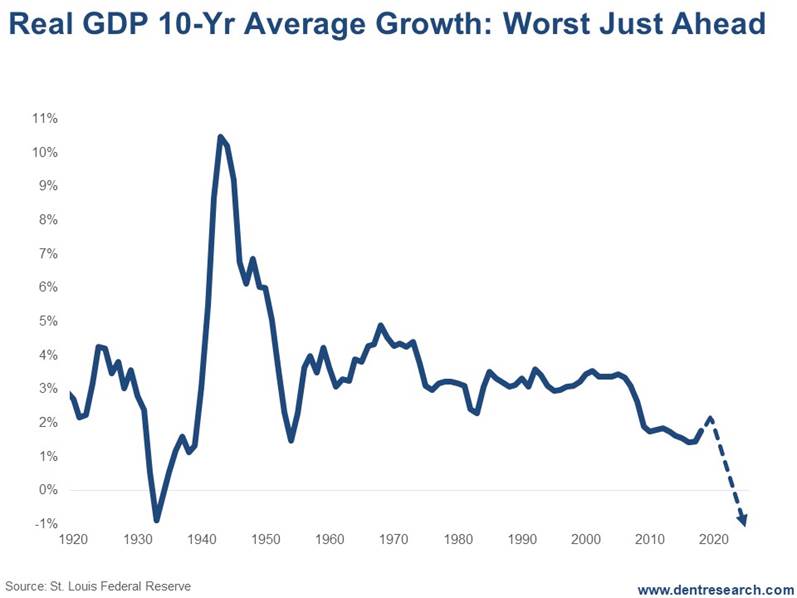
The next chart shows real GDP on a 10-year moving average to smooth out the trends.
Look at that remarkable difference: The period after 2007, with an average of 2% GDP, has already been lower than the extended recession and inflation trends of the Economic Summer Season from 1968 to 1982.
This tells me that this Economic Winter Season will go out with a bang (as opposed to beginning with one, like with the Great Depression).
A final deep depression, debt deleveraging and economic crisis will see a 20%-plus fall in GDP, 15%-plus unemployment, and a stock crash that could rival that -89% for the Nasdaq and maybe even the Dow.
Talk about ass-backward.
The good news…
The good news is that my four key fundamental indicators are generally at their worst between 2020 and 2023 and turn up one by one after 2020. The Geopolitical Cycle turns up after 2020 as does the sunspot-driven Boom/Bust Cycle. The U.S. Generational Spending Wave turns up in 2023, making the 45-year Technology Cycle the last to flip, around 2032.
Hence, the worst of the next great crash is likely to occur by late 2020, and we won’t come out of it until 2023 or so.
After that, we should enjoy a stronger recovery and quick reforms that actually deal with the debt crisis this time.
Still, we won’t see as strong a recovery as that from 1933 forward because we face weaker demographic trends in the U.S. and developed world. The outstanding growth will occur in the emerging world, especially places like India and Southeast Asia.
I don’t expect that the central banks can create another heroic turnaround this time when their last “something for nothing” stimulus program fails so miserably. They didn’t deal with the debt and financial bubbles last time, so expect the worst ahead after this final bubble peaks later this year, or early 2020 at the latest.
Harry
Follow me on Twitter @HarryDentjr
P.S. Another way to stay ahead is by reading the 27 simple stock secrets that our Seven-Figure Trader says are worth $588,221. You’ll find the details here.
Harry studied economics in college in the ’70s, but found it vague and inconclusive. He became so disillusioned by the state of the profession that he turned his back on it. Instead, he threw himself into the burgeoning New Science of Finance, which married economic research and market research and encompassed identifying and studying demographic trends, business cycles, consumers’ purchasing power and many, many other trends that empowered him to forecast economic and market changes.
Copyright © 2019 Harry Dent- All Rights Reserved Disclaimer: The above is a matter of opinion provided for general information purposes only and is not intended as investment advice. Information and analysis above are derived from sources and utilising methods believed to be reliable, but we cannot accept responsibility for any losses you may incur as a result of this analysis. Individuals should consult with their personal financial advisors.
© 2005-2022 http://www.MarketOracle.co.uk - The Market Oracle is a FREE Daily Financial Markets Analysis & Forecasting online publication.