


Is the Stock Market’s Volatility About to Spike?
Stock-Markets / Stock Markets 2019 Jun 19, 2019 - 05:57 PM GMTBy: Troy_Bombardia

 By some measures, the stock market’s volatility is starting to go up with the stock market itself. Does this mean that a short term spike in volatility (and short term decline in stocks) is impending? Today’s headlines:
- VIX and stocks
- Volatility of volatility
- Small caps indecision
- Fed day
- Oil’s plunge last week
- Gold miners are on fire
Go here to understand our fundamentals-driven long term outlook. For reference, here’s the random probability of the U.S. stock market going up on any given day.

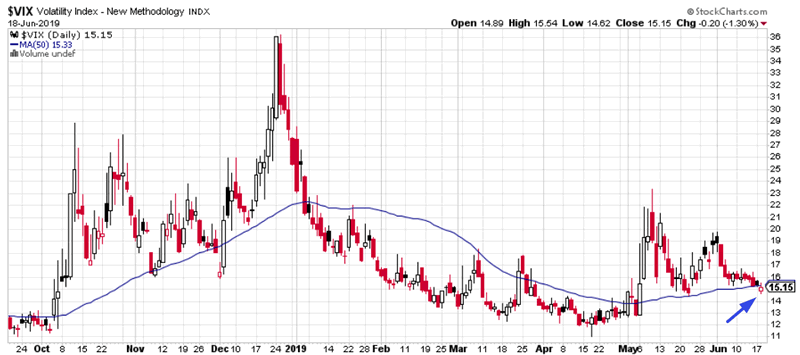
VIX and stocks
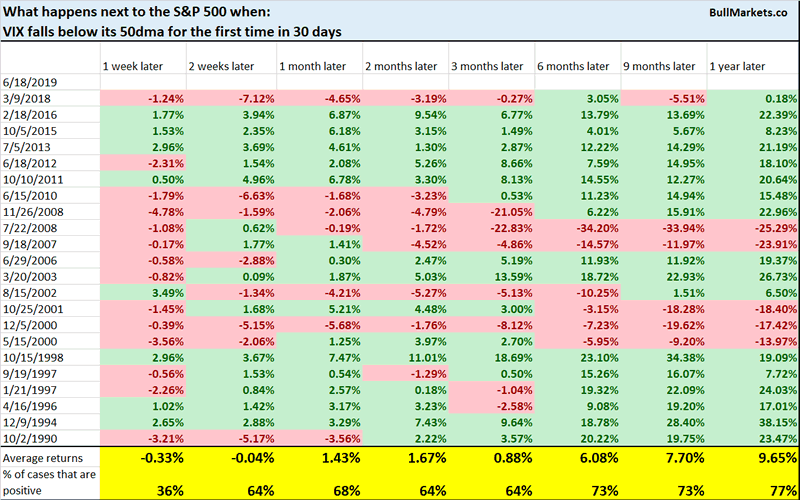
VIX fell below its 50 day moving average today as the stock market rallied. This is the first close below its 50 dma in more than 30 days.
Historically, this was often bearish for the S&P 1 week later.
Meanwhile, 4 of the past 10 days have seen VIX and the S&P move in the same direction (both close green, or both close red). This is unusual, because VIX and the S&P tend to move together.
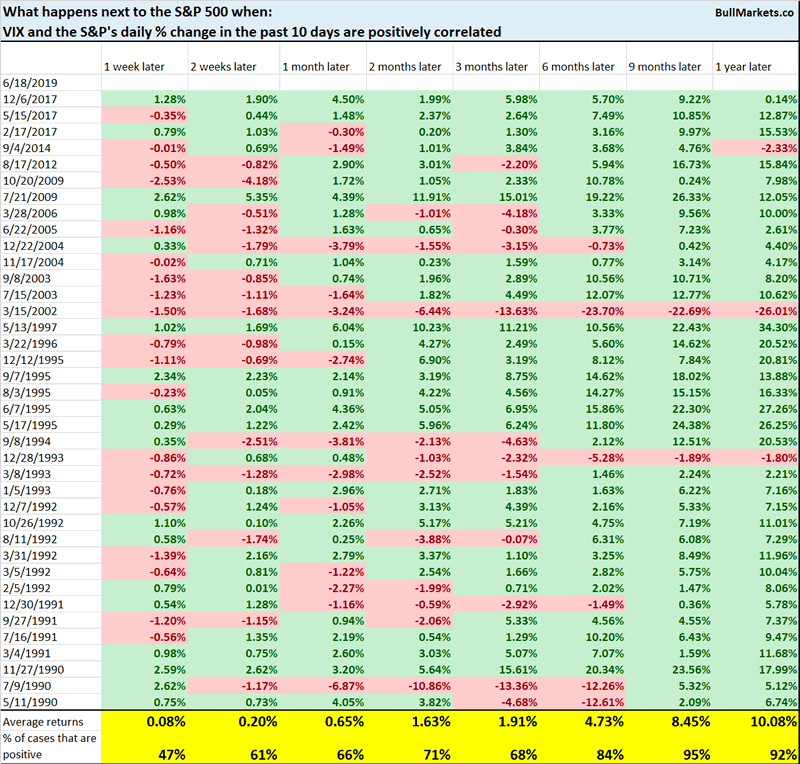
As a result, VIX and the S&P’s 10 day correlationis now positive.
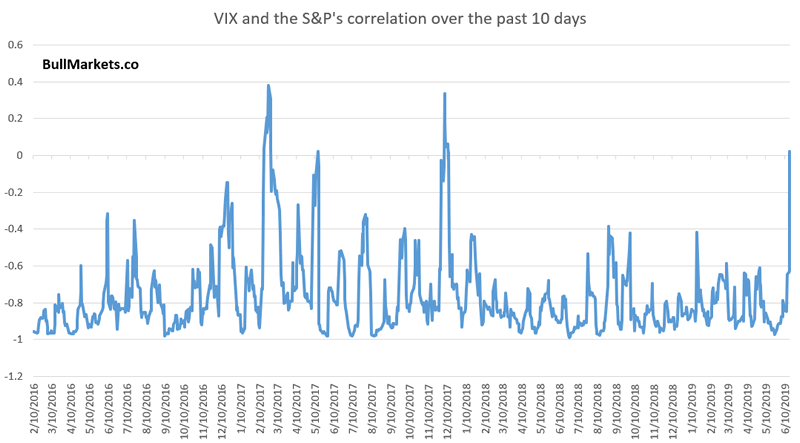
Historically, this was slightly bearish for the S&P 1 week later, but almost exclusively bullish 9-12 months later.
Volatility of volatility
One last point about volatility. VVIX (volatility of volatility) went up today even though the S&P went up. This doesn’t usually happen.
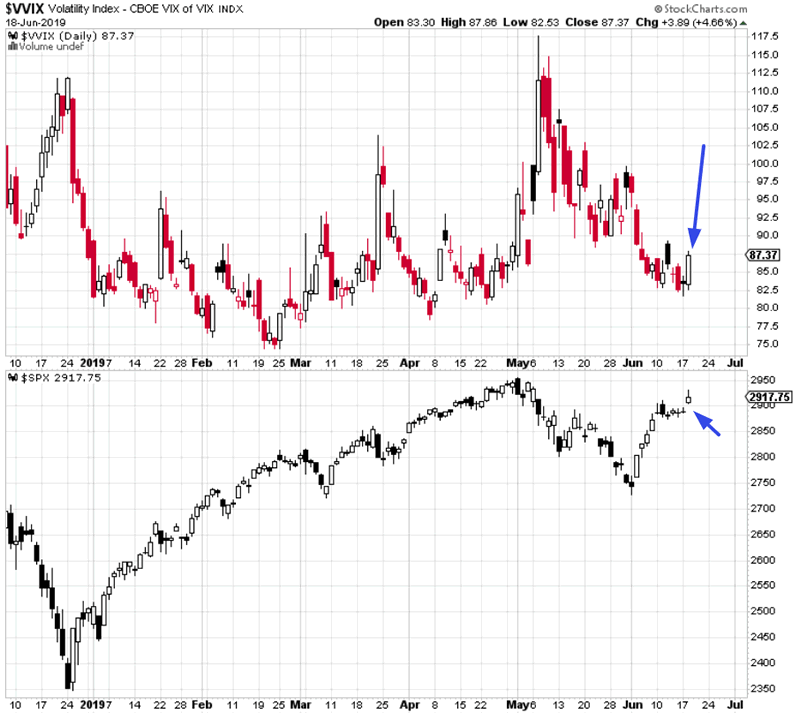
From 2007-present, there are only 15 other days in which VVIX went up more than +4% while the S&P went up more than +0.9%
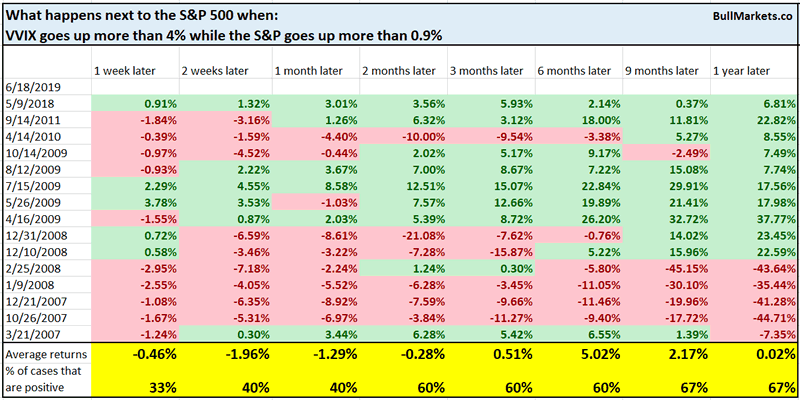
The S&P’s 1-2 week forward returns leaned bearish.
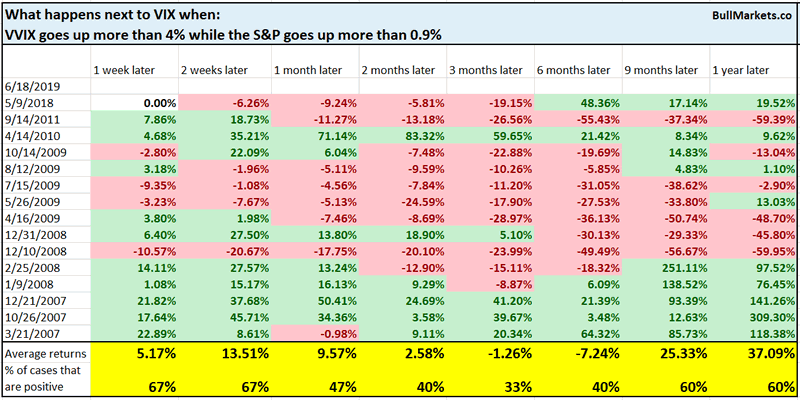
VIX’s 1-2 week forward returns leaned bullish.
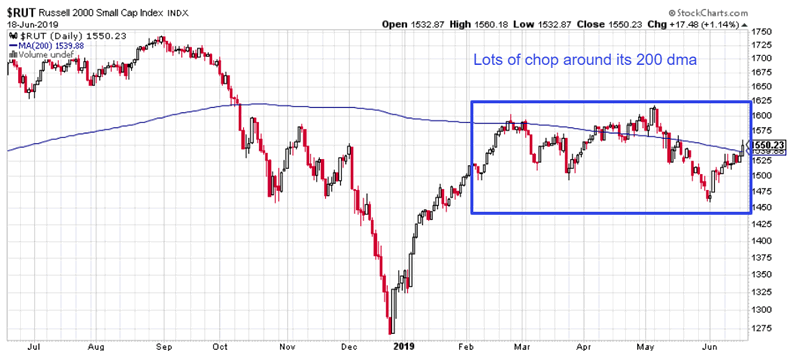
Small caps indecision
Most of our market studies recently have been bullish on stocks over the next 6-12 months. One of the few long term points of concern is the Russell 2000’s weakness.
*Russell 2000 = small caps index.
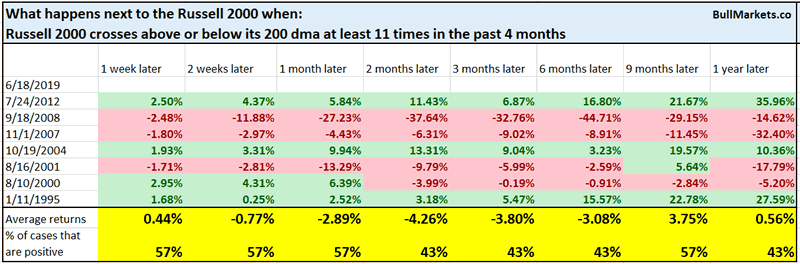
The Russell 2000 has crossed its 200 dma 11 times in the past 4 months. That demonstrates a lot of indecision around the Russell’s long term trendline.
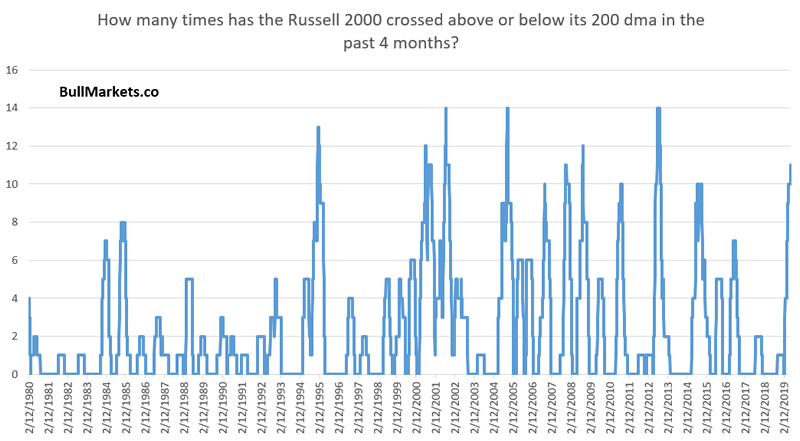
Here’s what happened next to the Russell 2000 when there was this much indecision (historically).
Here’s what happened next to the S&P.
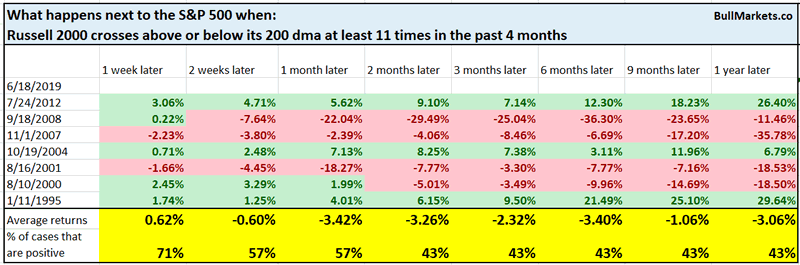
Long term forward returns are more bearish than random.
Fed Day
Tomorrow is Fed day. 10 of the past 11 Fed days have seen the S&P fall.
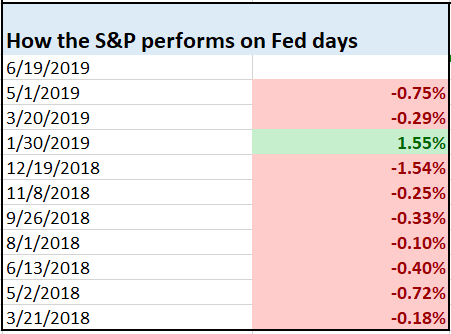
Does this mean that the S&P will fall tomorrow? I don’t know. Most of the recent Fed days have involved market participants speculating about how fast the Fed will hike rates. This Fed meeting is the opposite – it involves market participants speculating about how soon the Fed will cut rates. So perhaps the S&P will go up tomorrow.
Either way, I don’t predict the market’s day-to-day price. It’s like tossing a coin (50/50 odds).
Oil
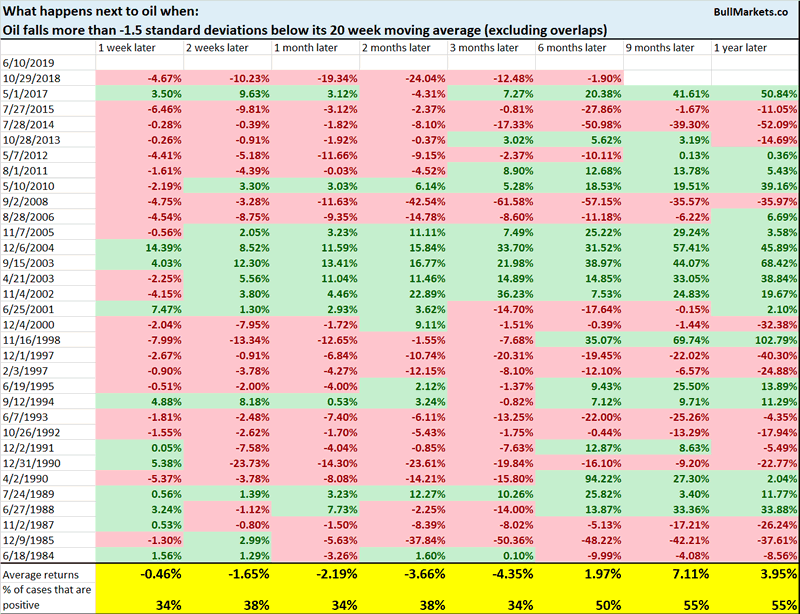
While oil is trying to recover last week’s losses, it’s important to remember that oil fell more than -1.5 standard deviations below its 20 week moving average last week. (Standard deviations are used in Bollinger Bands).
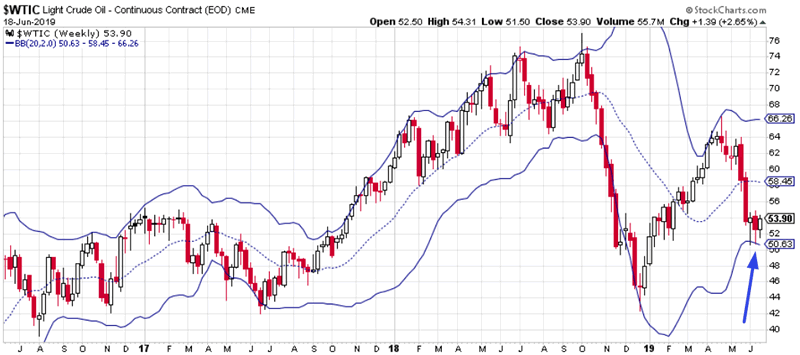
These type of shocks could see oil bounce in the short term (e.g. right now), but often led to more losses over the next 3 months.

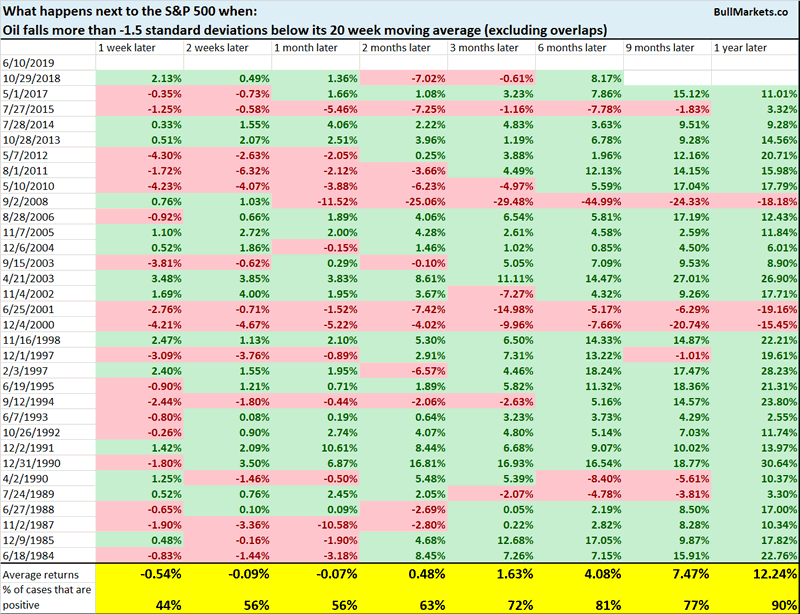
And no, this was not consistently bearish for the S&P.
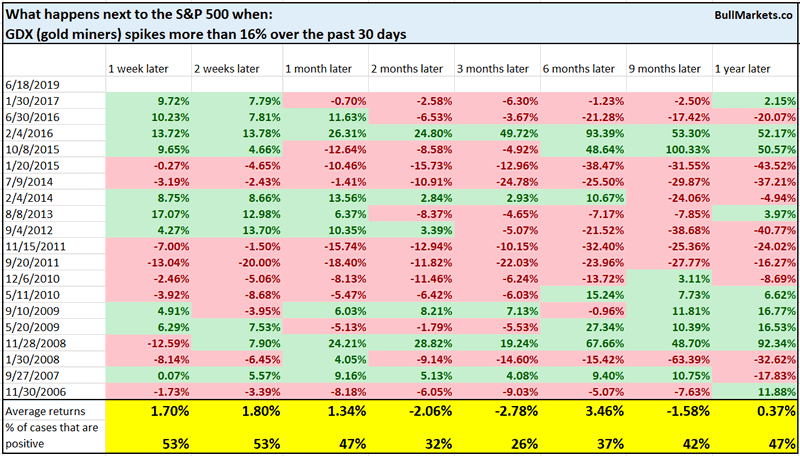
Gold miners
And lastly, gold miners have surged recently. GDX (gold miners ETF) has rallied more than 16% over the past 30 days.
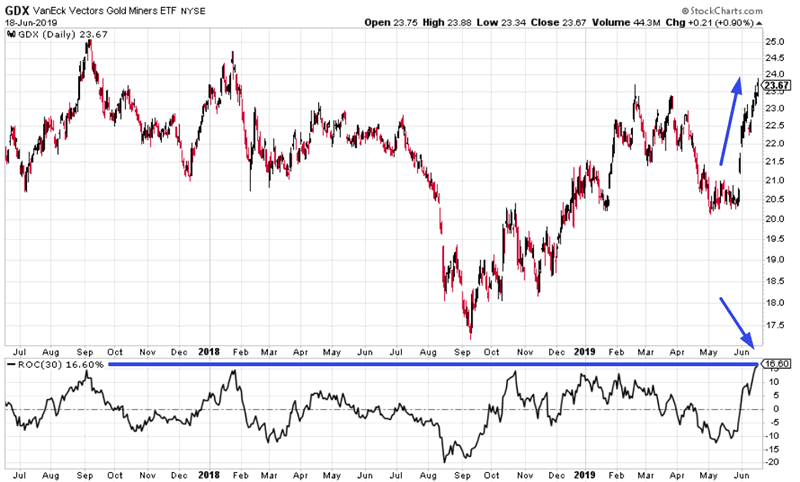
Historically, this was mostly bearish for gold miners 3 months later. Mean reversion
We don’t use our discretionary outlook for trading. We use our quantitative trading models because they are end-to-end systems that tell you how to trade ALL THE TIME, even when our discretionary outlook is mixed. Members can see our model’s latest trades here updated in real-time.
Conclusion
Here is our discretionary market outlook:
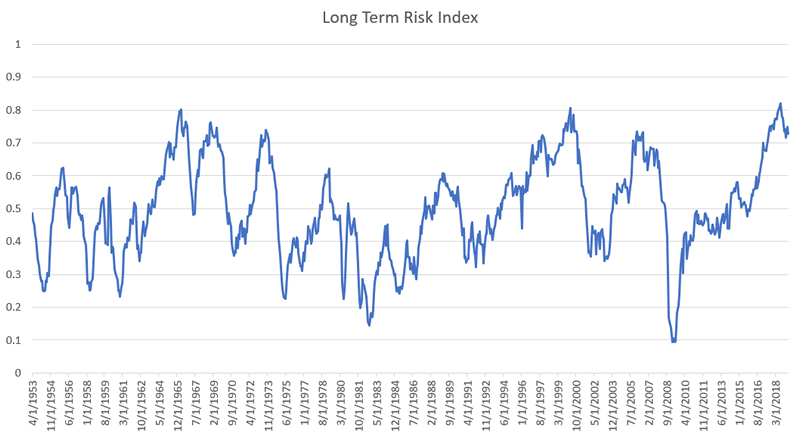
- The U.S. stock market’s long term risk:reward is not bullish. In a most optimistic scenario, the bull market probably has 1 year left.
- The medium term market studies (e.g. next 6-9 months) are mostly bullish.
- Market studies for the next 2-3 months lean bullish.
- Market studies over the next 2-4 weeks are mixed.
- We focus on the medium-long term.
Goldman Sachs’ Bull/Bear Indicator demonstrates that risk:reward does favor long term bears.
Click here for more market studies
By Troy Bombardia
I’m Troy Bombardia, the author behind BullMarkets.co. I used to run a hedge fund, but closed it due to a major health scare. I am now enjoying life and simply investing/trading my own account. I focus on long term performance and ignore short term performance.
Copyright 2019 © Troy Bombardia - All Rights Reserved
Disclaimer: The above is a matter of opinion provided for general information purposes only and is not intended as investment advice. Information and analysis above are derived from sources and utilising methods believed to be reliable, but we cannot accept responsibility for any losses you may incur as a result of this analysis. Individuals should consult with their personal financial advisors.
© 2005-2022 http://www.MarketOracle.co.uk - The Market Oracle is a FREE Daily Financial Markets Analysis & Forecasting online publication.