


Stock Market New High, but…!
Stock-Markets / Stock Markets 2019 Jun 24, 2019 - 06:09 PM GMTBy: Andre_Gratian

 Current Position of the Market
SPX: Long-term trend – Finallong-term phase on the way? How much longer, is the question.
Intermediate trend – The intermediate-term correction continues to unfold.
Analysis of the short-term trend is done on a daily basis with the help of hourly charts. It is an important adjunct to the analysis of daily and weekly charts which discusses the course of longer market trends.
Daily market analysis of the short-term trend is reserved for subscribers. If you would like to sign up for a FREE 4-week trial period of daily comments, please let me know at ajg@cybertrails.com
A New High, but…!
Market Overview
“If it does move higher from here, there has been enough congestion created over the past few days for it reach between 2930 and 2950 while, during that time, remaining below the two resistance lines.”
This was stated in last week’s analysis, and the SPX obliged by going even a little higher on Friday, reaching an all-time high of 2964. Does that mean that the long-term trend has resumed? Probably not! Although the initial corrective formation did not pan out structurally as was foreseen, the odds are pretty good that we are still in another type of corrective pattern which can still produce a great deal of weakness directly ahead.
On Friday, the index gave a strong indication that it was done going up for now. The final high was preceded by strong negative divergence in the hourly indicators, and a lesser one in the daily and weekly indicators; the short-term projection was achieved and even slightly exceeded; breadth remained negative all day; aggressive selling occurred at the close with the index closing near the low and down for the day; aggressive selling continued in the futures after the close as well! It would take some very positive news to surface over the weekend to prevent this late session weakness from continuing on Monday morning.
Assuming that we did make a short-term top on Friday, there is probably enough congestion to cause a retracement to about 2900. That level should provide good support and arrest the decline, at least temporarily. If we get there too soon, we risk going lower since there is a minor cycle due next Friday/Monday. This cycle is not much of a concern in a market uptrend, but it can carry quite a punch in a downtrend; so if we get to 2900 early, we could easily continue declining beyond that level going into the cycle low. If that should happen, this could spell the resumption of our intermediate correction! In any case, what the market does over the near term should shed some clarity on its future course.
Technical analysis (Charts appearing below are courtesy of QCharts.)
SPX daily chart
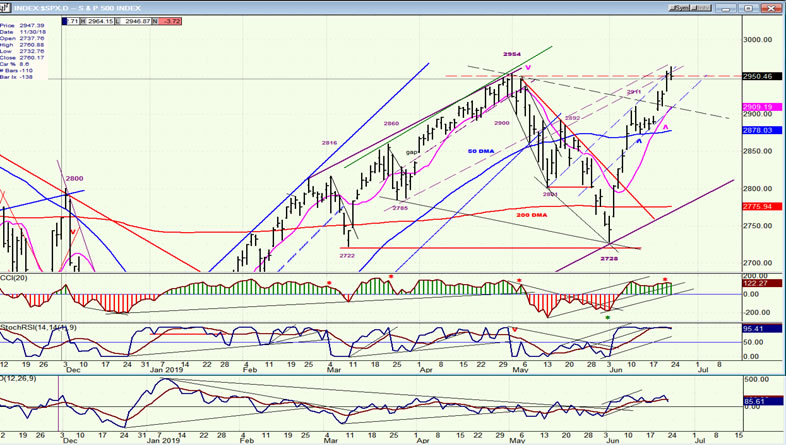
On Friday, SPX made a new all-time high by ten points, but could not hold it and retraced immediately. It also had a very poor close, as was mentioned above. Considering all the factors which marked Friday’s action, we have to assume that the best analysis is that SPX did make a short-term high. Whether or not this is the end of the rally from the December low remains to be seen. If it is, the index could have traced out an a-b-c corrective pattern – or is still in the process of doing so if Friday’s move does not spell out the end of that uptrend. When we get to the portion of this letter which discusses the four indexes that we follow, I will list several technical reasons why I believe that we may not be ready just yet to continue the bull market which started in 2009. I do believe that we will do so at some point in the future, but not before we see another significant market correction. In other words, from an EWT perspective, we are still in the process of tracing out wave IV of the bull market.
I had expected the dashed trend lines drawn on the chart to contain any move higher, whether or not we made a new high. This is in fact what happened and on Friday, when prices were repelled and closed down for the day. The next move is expected to be on the downside; perhaps to the general vicinity of the 2900 level where there are trend lines, some congestion, and MAs. One of those should stop the price retracement, at least temporarily.
I also mentioned earlier that negative divergence had formed in the oscillators. I marked it in the CCI with a red asterisk, and should have done so in the A/D indicator as well. However, the divergence is mild and the SRSI is simply overbought and has barely turned down, meaning that we probably should not expect serious weakness in the pull-back -- at least not right away.
SPX hourly chart
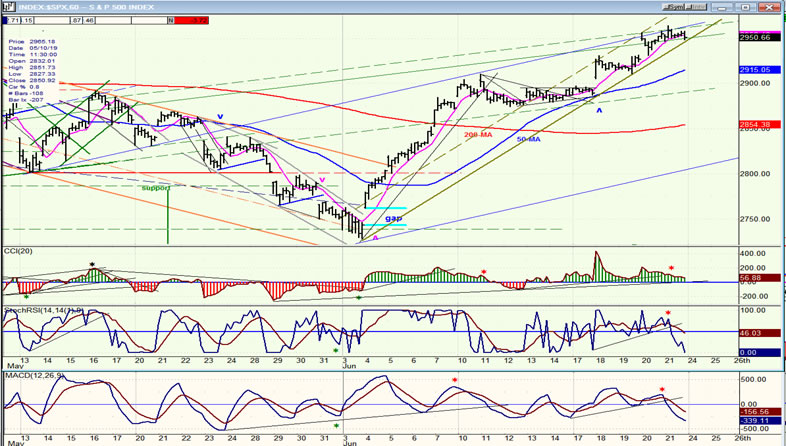
On the hourly chart, we can see more clearly how the blue trend line (especially) contained prices. We can also see that all three oscillators show much more weakness than appears at the daily level. This is one of the reasons I am expecting a short-term top to form in this area, and for the price retracement which started at the close of Friday, to continue on Monday.
The support area is also much better defined on this chart. The last minor cycle could not do more than move prices sideways for four or five days. This created a congestion area around the 2900 level which should be sufficient to hold any retracement that takes place over the near-term. If we do retrace that far next week, will there still be enough strength left in the market to lift the index even higher? I suppose it will depend on the outcome of the meeting between Trump and Xi at the G20 next weekend. If some sort of resolution to the trade war occurs, then we continue the short-term uptrend. If not – well, we’ll see!!!
QQQ, SPX, DJIA, IWM (weekly)
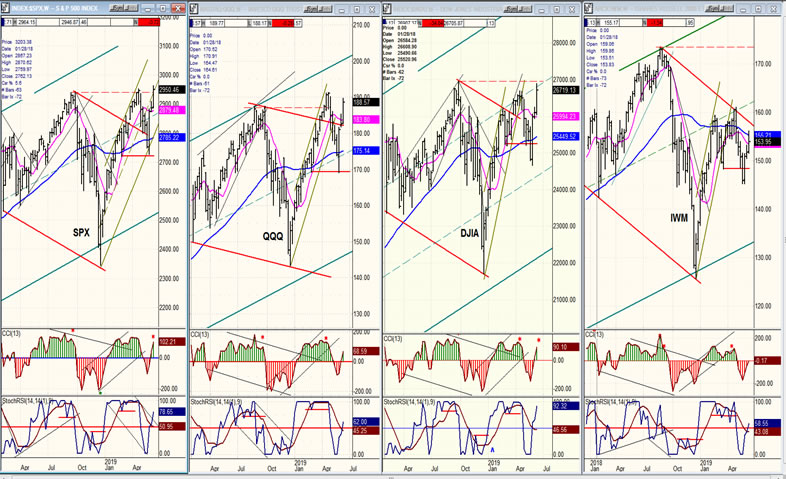
This week will reveal the importance of analyzing the weekly charts in order to determine the market trend. It will reveal as well the perspective obtained by comparing major indexes, especially when one of them (IWM) has a proven reputation for being a leading indicator. The recent strength in the indices suggests to many investors that the market is still in a long-term uptrend. And they are right! Just last week, SPX made a new all-time high. But it was the only index to do so. Is that trend sustainable? Collectively, the charts listed below say NO!
A look at IWM is sufficient to get a clear answer to that question, which is a strong negative. We also note that QQQ, which was the strongest index for a long time, has been losing relative strength to the others and is in the process of falling into the third position. This is not a bullish sign! Finally, if we look at the oscillators of the strongest index (SPX), we can see that they display negative divergence. Granted, it’s too early to arrive at a firm conclusion about this index, since its indicators are still rising and could catch up with the price, but in a strong market, oscillators lead, they do not follow. Conclusion: While things may change, there is no indication that the current uptrend is sustainable.
UUP (dollar ETF)
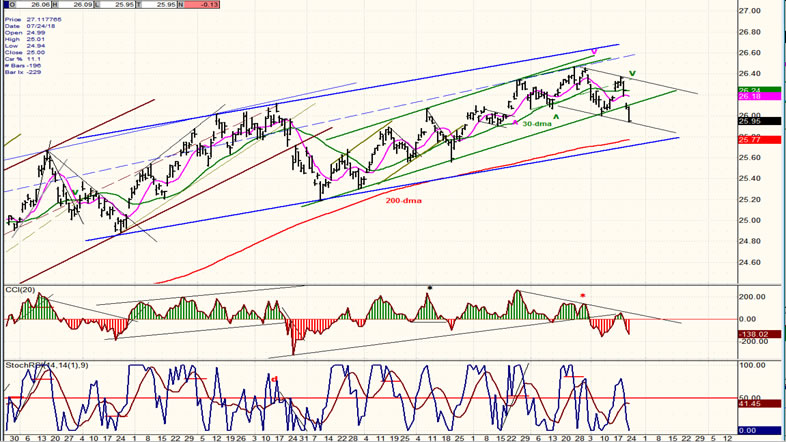
After giving signs that it was about to start a correction, UUP finally has one underway -- at least for the short term. It has now completely come out of its green channel and is aiming for the bottom of the blue one which is running parallel to the 200-dma. UUP is a slow mover and this will take some time. Also, it has formed a small downtrend channel and has reached the lower channel line where it is likely to find temporary support which can cause a bounce within the near-term downtrend.
GDX (Gold miners ETF) daily
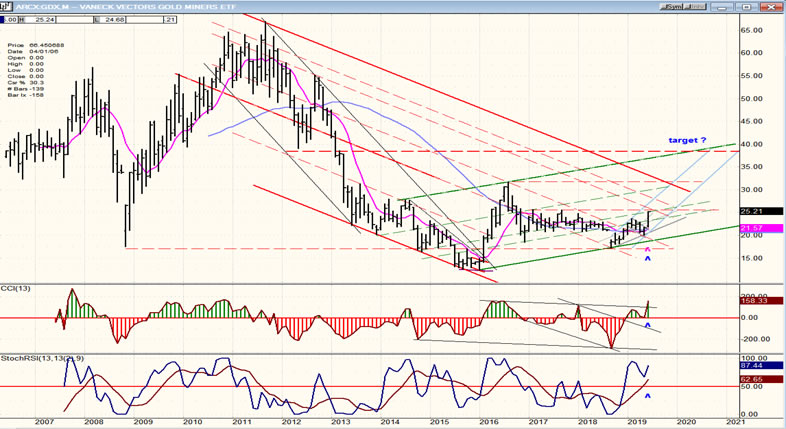
With gold apparently waking up after a long snooze, it is important to get a clear idea of what lies ahead. I have posted a monthly chart of GDX which gives us a good perspective of what it is doing, and we will analyze it first. The index reached a peak of 67 in 2011 and started a long-term correction which took it all the way down to 12.50 in January of 2016. An oversold bounce of six-plus months to 32 ended the long-term correction and started a base-building process which apparently ended in September 2018 at 17. After an initial rally to 23, and a three month pull-back, GDX was ready for its next move which got underway 4 weeks ago.
On the chart below, I show the long-term downtrend channel in red which is still in effect and will continue to be until the top channel line is overcome. The dashed lines may provide temporary obstacles to the price as it seeks to reach it. When it does reach it, it will also encounter resistance from the August 2016 top which should stop the advance for a little while. In the meantime, the index is establishing a bullish, intermediate countertrend green channel which has the potential of taking it to about 40, AFTER it has broken out of the red bearish channel.
The base which has been established on the P&F chart, provides us with an initial count to 25-25.50 has now been reached. GDX should continue to 33-34, and finally to about 43 where it should attain the top of the green channel. All these are potential counts, but the long-term chart profile suggests that they will be realized.
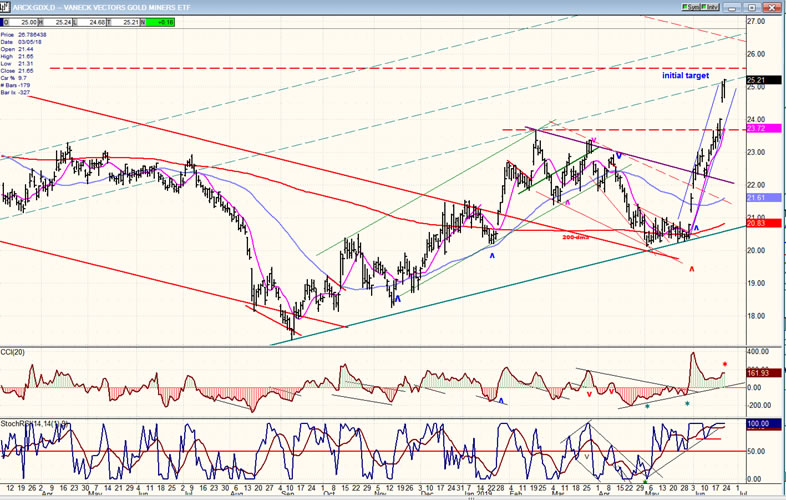
I am also including a daily chart of GDX which can be used as a magnification of the monthly chart, and on which the near-term path can be readily observed. The initial P&F target has been reached and it coincides with some resistance which should bring about a short period of consolidation before the index can move on to its next target. This short-term target is validated by the position of the oscillators which are overbought with negative divergence. A consolidation period is expected to follow and last two to three weeks.
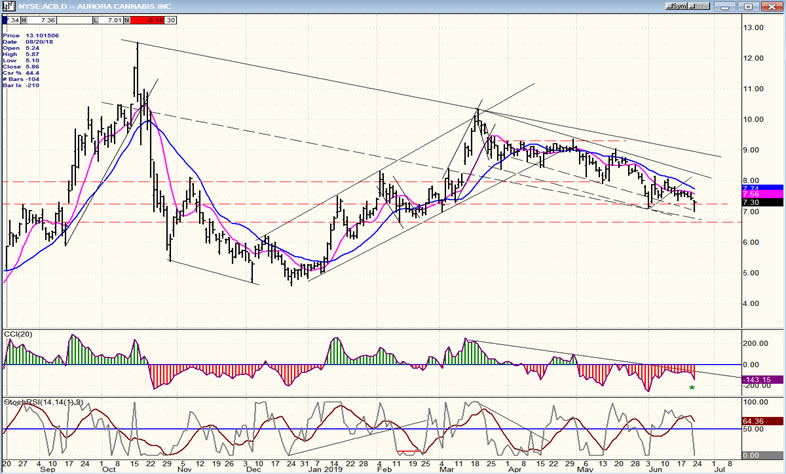
ACB (Aurora Cannabis) daily
ACB continues to correct with the rest of the stocks in the group, but since ACB is one of the industry’s leaders, it is becoming more of a bargain every week. The top oscillator is showing some positive divergence, so we need to keep an eye on the stock to see if this suggests that it is close to a reversal.
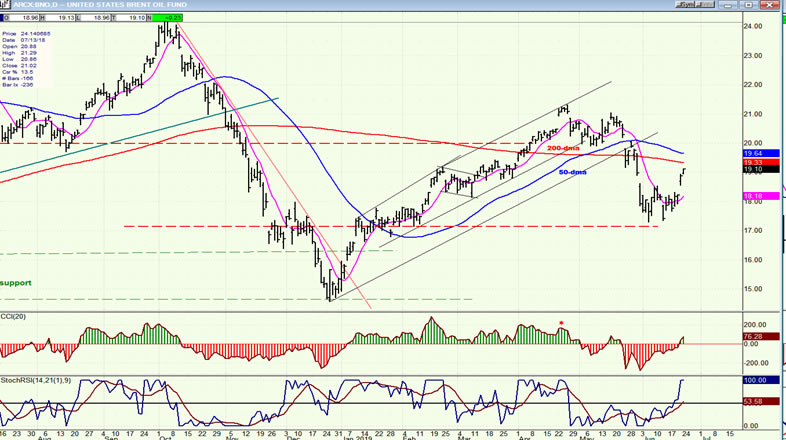
BNO (U.S. Brent oil fund) daily
BNO has benefited from tension in the Middle-East which has caused oil to rally. Technically, it is approaching its 200-dma which could provide resistance and put an end to the rebound.
Summary
SPX appears to have reached a short-term high on Friday. Although this was an all-time high for the index, it is not expected to have an immediate follow through unless some resolution to the tariff war is reached at the G20 meeting. If not, this could be the top of the corrective move from 2346 and be followed by another substantial correction.
Andre
FREE TRIAL SUBSCRIPTON
For a FREE 4-week trial, send an email to anvi1962@cableone.net, or go to www.marketurningpoints.com and click on "subscribe". There, you will also find subscription options, payment plans, weekly newsletters, and general information. By clicking on "Free Newsletter" you can get a preview of the latest newsletter which is normally posted on Sunday afternoon (unless it happens to be a 3-day weekend, in which case it could be posted on Monday).
Disclaimer - The above comments about the financial markets are based purely on what I consider to be sound technical analysis principles uncompromised by fundamental considerations. They represent my own opinion and are not meant to be construed as trading or investment advice, but are offered as an analytical point of view which might be of interest to those who follow stock market cycles and technical analysis.
Andre Gratian Archive |
© 2005-2022 http://www.MarketOracle.co.uk - The Market Oracle is a FREE Daily Financial Markets Analysis & Forecasting online publication.