


Market’s flight-to-safety: Should You Buy Stocks Now?
Stock-Markets / Stock Markets 2019 Aug 10, 2019 - 01:43 PM GMTBy: Troy_Bombardia

 The stock market and bond yields recovered today from an early morning decline. Meanwhile, financial markets have exhibited some extreme flight-to-quality over the past few days. Today’s headlines:
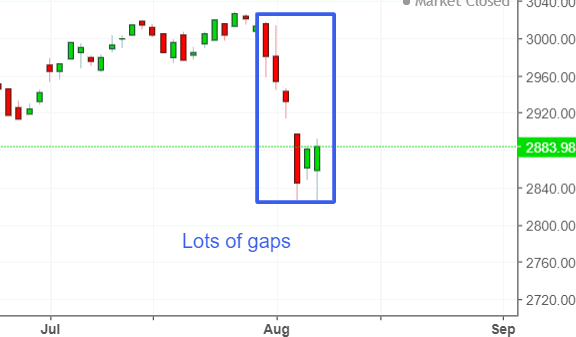
- Lots of gaps
- Put/Call ratio remains high
- Flight to quality: part 1
- Flight to quality: part 2
- Similarities between today and 2016
- Bullish Percent falling to a new low
- Gold spiked (again)
Go here to understand our long term outlook. For reference, here’s the random probability of the U.S. stock market going up on any given day.

Gaps
The S&P 500 has gapped a lot recently on the open. Gaps are common in a:
- News-driven environment
- Stock market crash (big swings during non-market hours)
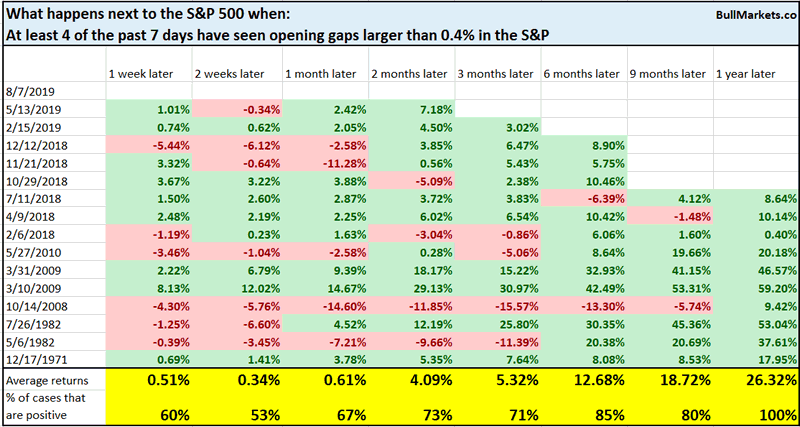
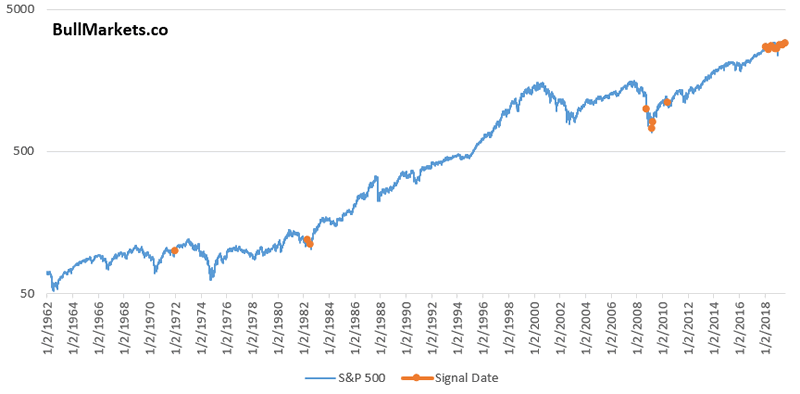
The past 7 days have seen 4 opening gaps that are greater than 0.4% (absolute value %).
Similar historical cases with lots of gaps saw mixed forward returns in the short term, but were mostly bullish 6-12 months later.
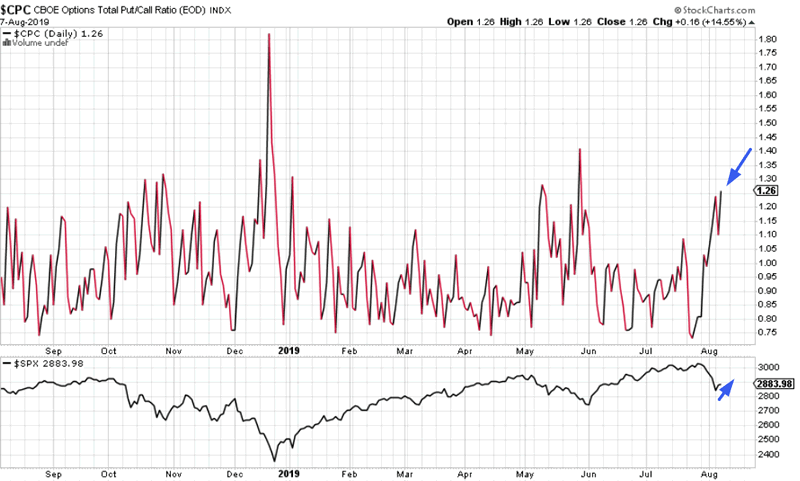
Put/Call
The Put/Call ratio tends to move inversely with the S&P when the S&P is volatile.
- Stocks crash, put/call ratio goes up
- Stocks rally, put/call ratio goes down
This did not happen today. The Put/Call ratio spiked to a new high even though the S&P did not make a new low vs. 2 days ago.
Here’s what happened next to the S&P when the Put/Call ratio is at a 2 month high, while the S&P is more than 1% above a 5 day low.
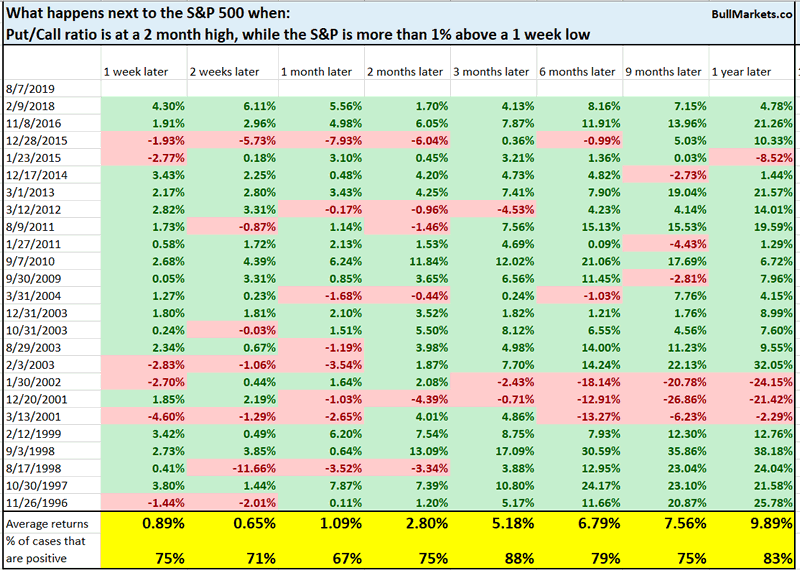
The S&P’s 3 month forward returns are mostly bullish.
Flight to safety
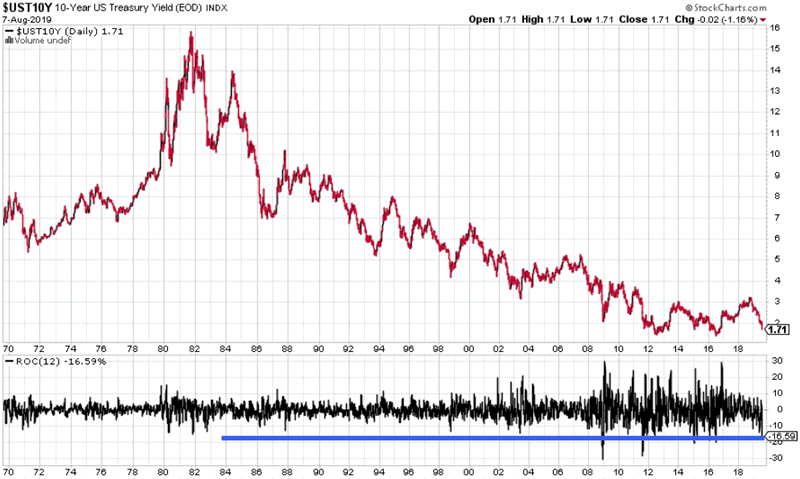
Plenty of market watchers have noted an extreme flight to safety. Bond yields have tanked as investors bid up traditional safe assets (e.g. bonds).
As a result, the 10 year Treasury yield’s 5 day rate-of-change has fallen below -16%. This is on par with figures during many other stock market crashes:
- 2008/2009
- 2011
- 2015
- 2016
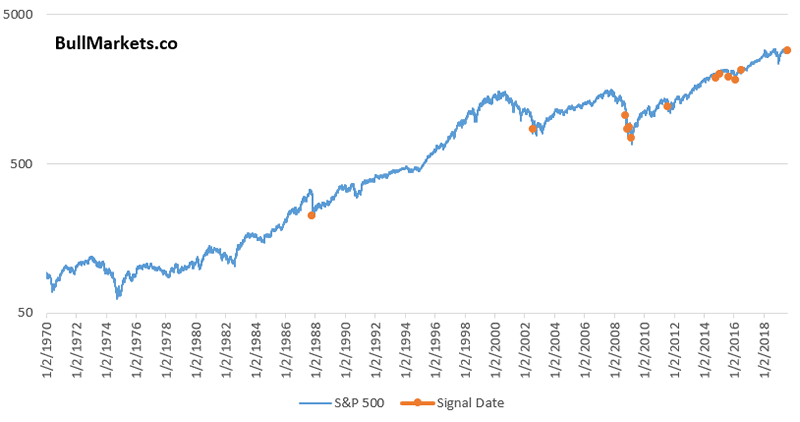
Here’s what happened next to the S&P when the 10 year yield’s 5 day rate-of-change fell below -10%.
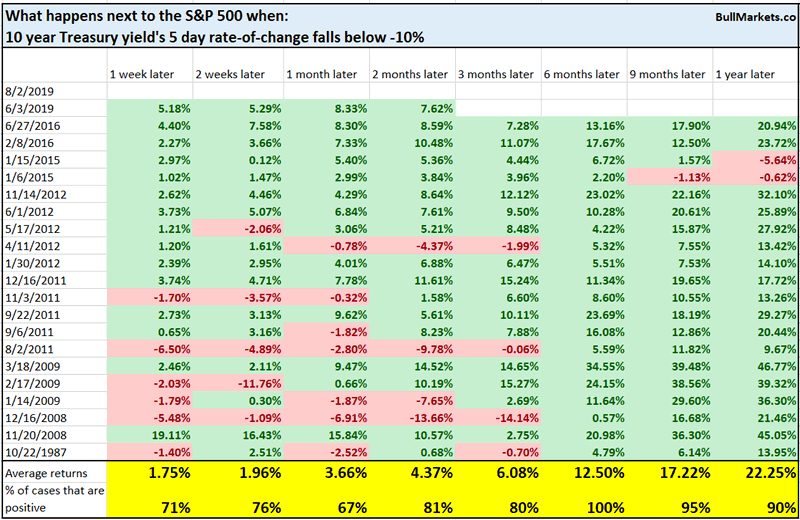
The 6-12 month forward returns were mostly bullish.
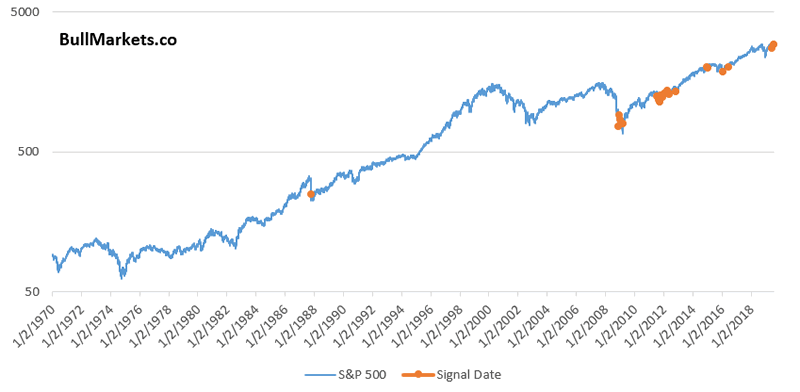
Here’s what happened next to the 10 year Treasury yield.
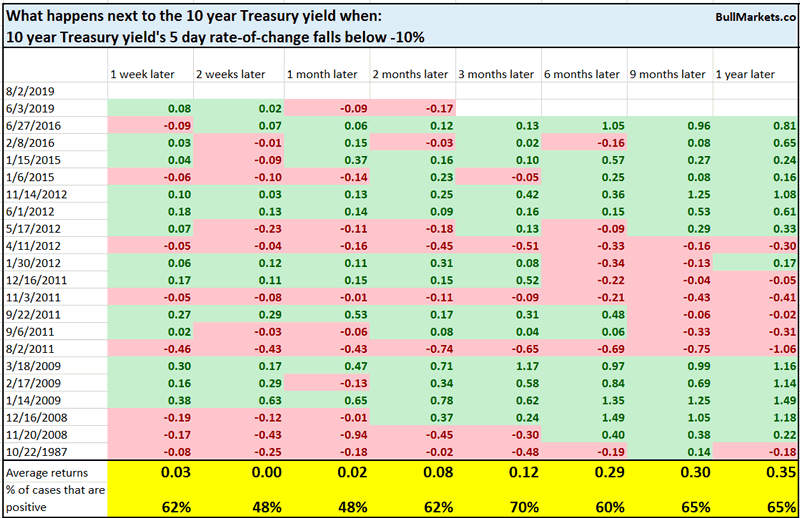
The 10 year yield usually rallied over the next 3 months.
Flight to safety: part 2
Tom McClellan looked at the flight to safety in a different way. Instead of just looking at the change in Treasury bonds, he added the change in stocks. When stocks tank and bond prices surge (e.g. right now), there is flight to safety in the financial markets.
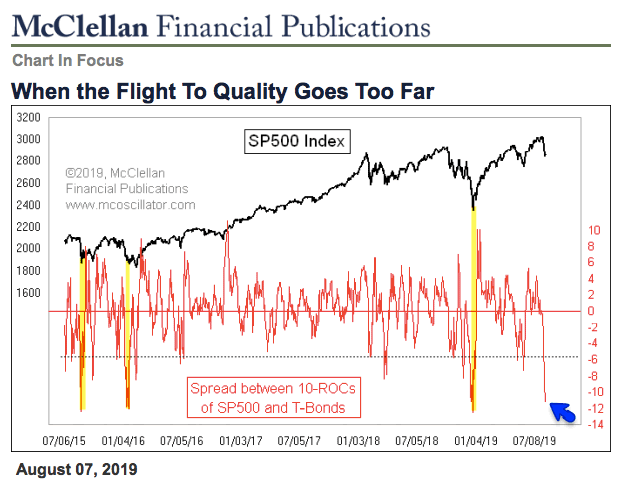
To avoid recency bias, here’s a more comprehensive chart that adds the 10 day rate-of-change in the S&P + the 10 day rate-of-change in the 10 year Treasury yield.
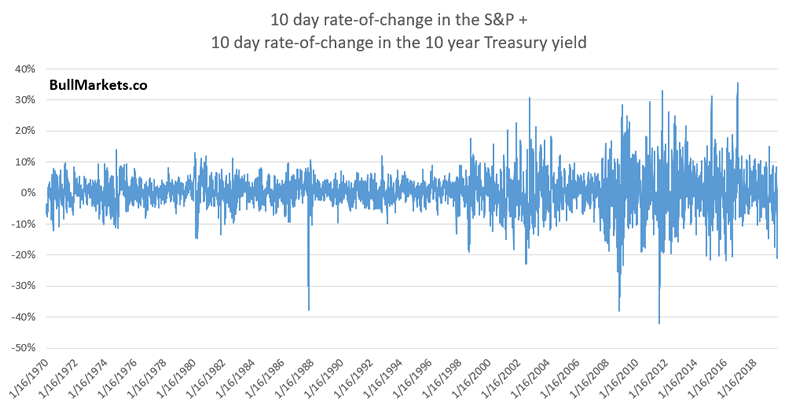
Here’s what happened next to the S&P when this figure fell below -20% in the past.
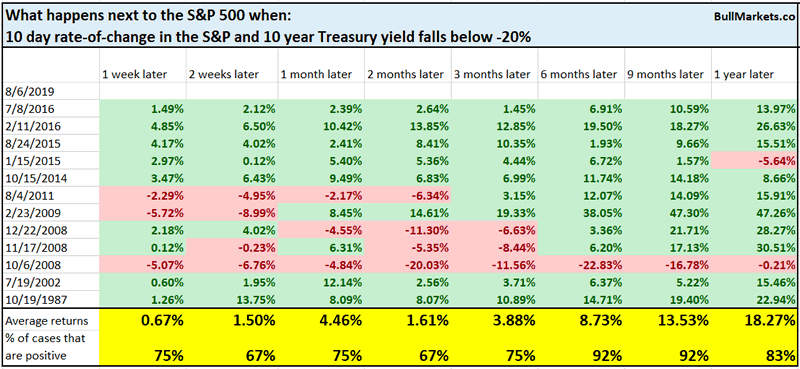
6-12 month forward returns were mostly bullish.
Similarities between today and 2016
Strategas noted that many different asset classes have done well this year. Stocks, bonds, gold, and REIT’s have all gone up a similar %.
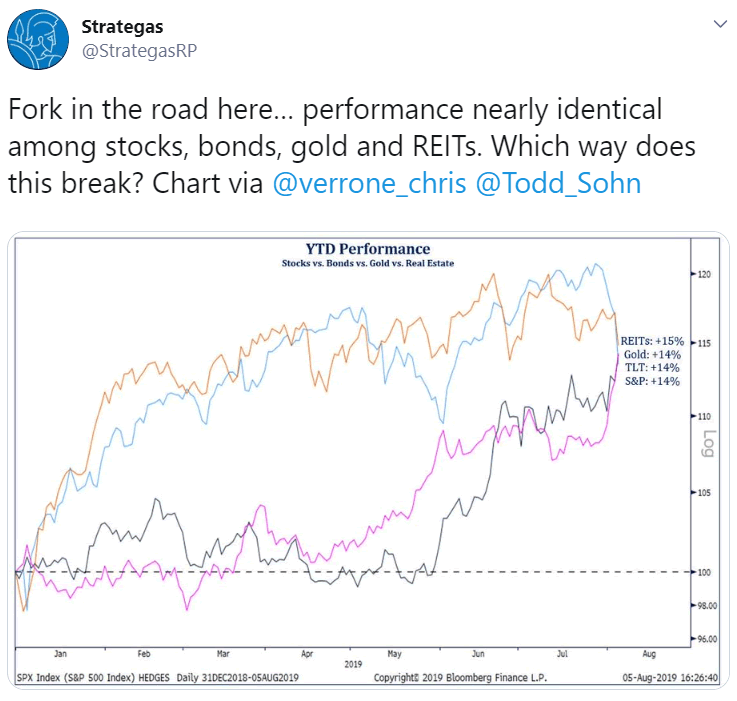
Aside from right now, there is only 1 other case in which the S&P, TLT, Gold, and Dow Jones REIT Index are up more than 13% over a 7 month period:
- Now
- August 2016
Does this mean that today is “2016 all over again”? No. Hard to make any conclusions from n=1.
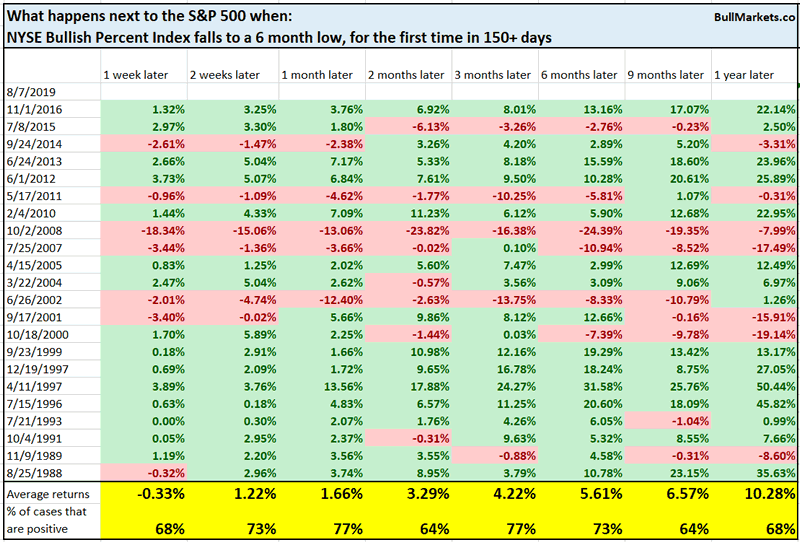
Breadth
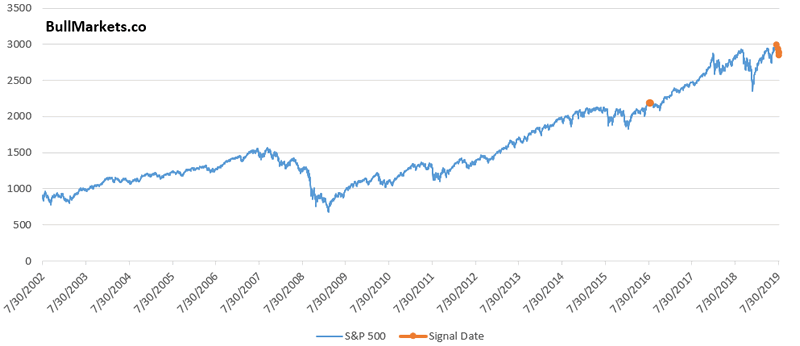
The NYSE Bullish Percent Index (a breadth indicator) has fallen to a 6 month low.
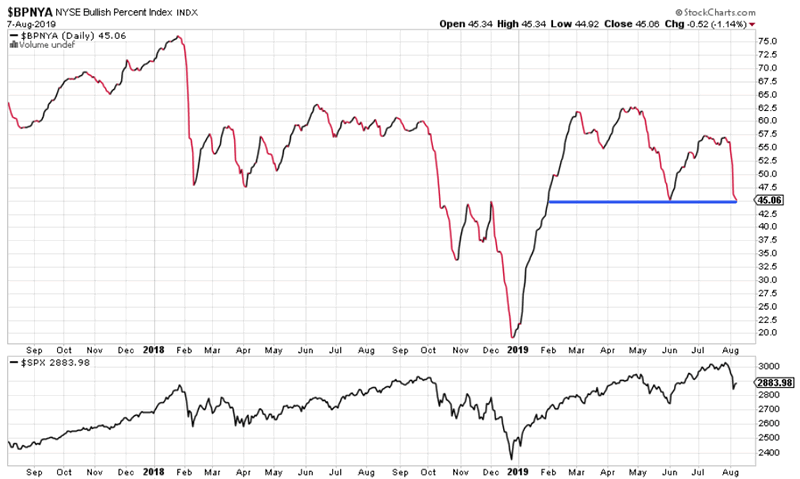
When the NYSE Bullish Percent Index fell to a 6 month low for the first time in more than 150+ days, the S&P’s 1 month forward returns were more bullish than random.
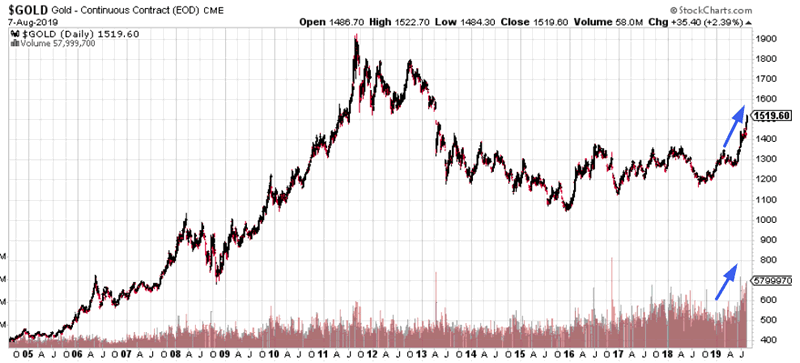
Gold
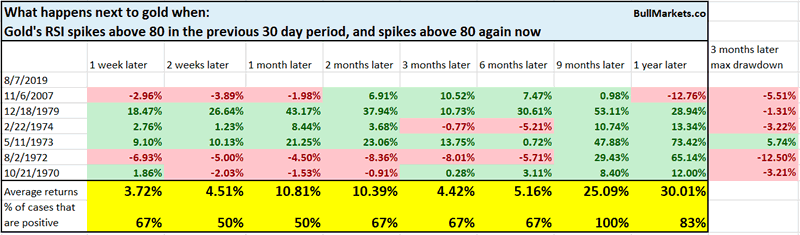
And lastly, let’s look at gold. The yellow metal continues to spike. Gold’s RSI (momentum indicator) has exceeded 80 twice over the past 30 days.
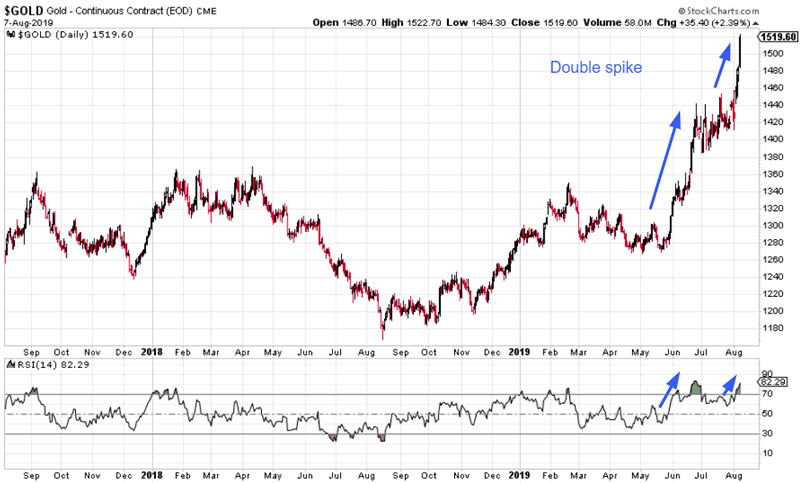
It’s rare for gold to spike twice during such a short period of time. When gold spikes (and RSI exceeds 80), it usually takes gold much more time to digest these overbought readings.
Rapid double spikes are signs of strong momentum. There are only 6 other cases, and gold performed well over the next 9 months.
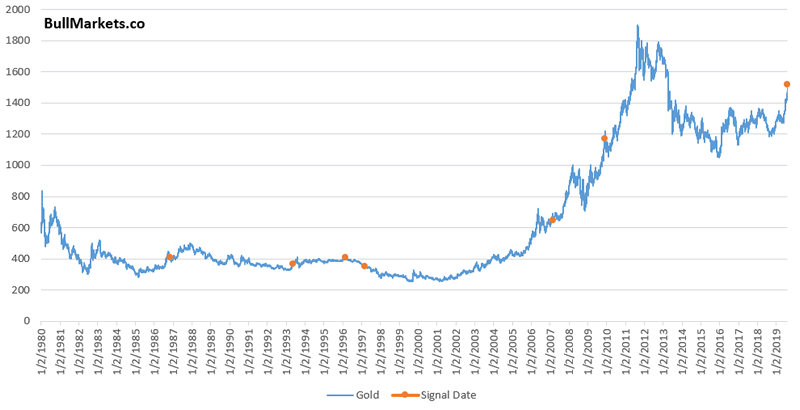
But should you chase gold at this current price? I don’t think it’s the best idea. Gold’s volume has expanded significantly during the recent rally.
We cannot look at the absolute level of volume, since this changes throughout the decades. Instead, we can look at gold volume’s 50 dma in relation to its 200 dma. The bigger this figure, the more gold’s volume is surging.
This figure currently stands at 37%. The 6 similar historical cases were mostly bearish for gold in the short term.
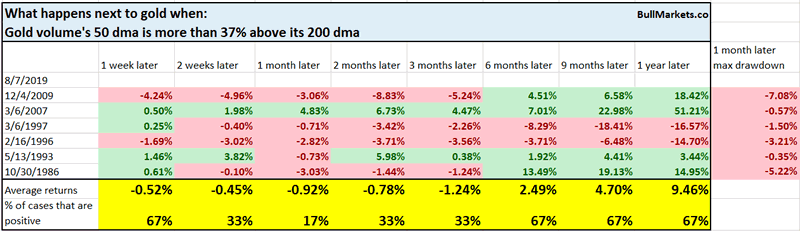
Take my gold thoughts with a grain of salt. I don’t trade gold, and these are small sample sizes.
We don’t use our discretionary outlook for trading. We use our quantitative trading models because they are end-to-end systems that tell you how to trade ALL THE TIME, even when our discretionary outlook is mixed. Members can see our model’s latest trades here updated in real-time.
Conclusion
Here is our discretionary market outlook:
- Long term: risk:reward is not bullish. In a most optimistic scenario, the bull market probably has 1 year left.
- Medium term (next 6-9 months): most market studies lean bullish.
- Short term (next 1-3 months) market studies are mixed.
- We focus on the medium-long term.
Goldman Sachs’ Bull/Bear Indicator demonstrates that risk:reward does favor long term bears.
Click here for more market analysis
Here’s what happens next to the S&P when lumber rallies above its 50 week moving
By Troy Bombardia
I’m Troy Bombardia, the author behind BullMarkets.co. I used to run a hedge fund, but closed it due to a major health scare. I am now enjoying life and simply investing/trading my own account. I focus on long term performance and ignore short term performance.
Copyright 2019 © Troy Bombardia - All Rights Reserved
Disclaimer: The above is a matter of opinion provided for general information purposes only and is not intended as investment advice. Information and analysis above are derived from sources and utilising methods believed to be reliable, but we cannot accept responsibility for any losses you may incur as a result of this analysis. Individuals should consult with their personal financial advisors.
Troy Bombardia Archive |
© 2005-2022 http://www.MarketOracle.co.uk - The Market Oracle is a FREE Daily Financial Markets Analysis & Forecasting online publication.