


Weekly Gold and Silver Technical Analysis Report - 1st April 2007 - Technically Precious with Merv
Commodities / Gold & Silver Apr 01, 2007 - 01:48 PM GMTBy: Merv_Burak

Other than Monday, the week's daily gold trading activity closed either lower on the day or at the low of its daily trading range. Not activity fraught with confidence.
TECHNICAL RATING (RATE)
In my tables of technical information and ratings (at the end of these commentaries) is a column called RATE for Technical Rating. Based upon the technical information in the table I had developed a program that then took this information and tried to determine if the stock or Index is technically bullish (POS), bearish (NEG) or neutral (N).
In addition, I added two extra ratings, one that is better than neutral but not yet bullish (+ N) and one that is worse than neutral but not yet bearish (- N). Now as we all know, being adults and all that, nothing is perfect and these ratings are not claimed to be perfect. However, I have been using them for some 15 years and they are as good as most ratings you will find, better than some and no doubt not as good as some. As a general rule one should expect that the ratings turn first in the shorter term period and then progressively in the longer periods.
One should never go by simple ratings alone in their decision making. One should also take a look at a chart and understand simple support/resistance and trend line techniques to confirm the ratings. Too often mechanically developed ratings are prone to being “whipsawed” and a look at a simple chart might just avoid that. You need not be a technical expert but should have some basic simple knowledge of technical concepts.
Very often in these commentaries I may differ with the ratings as shown in the tables. Again, that is because of the mechanical nature of the ratings and most likely due to the use of slightly different indicators than those in the table. Such difference of opinion should normally not last long. When a trend takes hold, both the commentary and ratings should be in concert.
Well I guess that just about covers the information one will find in the tables at the end of this commentary as well as the Global Indices tables one can find in my home web site. Now, on with the regular analysis.
GOLD
LONG TERM
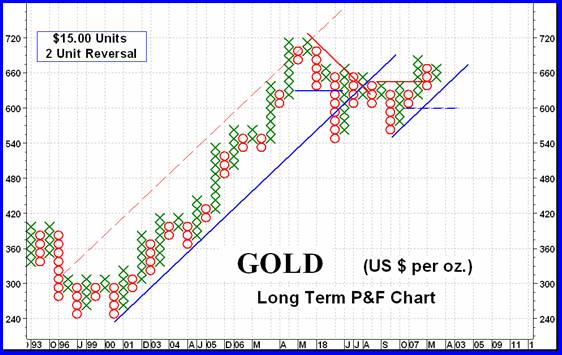
Those who have been following my commentaries for some time will remember that at the start of the bull market in gold my long term P&F chart was based upon $10.00 units. Last year as the price became more than double the start, such units started to produce a lot of reversals and were not sufficient to eliminate much of the minor price fluctuations at that elevated price level. The chart was then changed by upping the unit price to $15.00. That is the chart we have here and the one we have been following for many months now. Many of you are followers of the “Three unit reversal” method popularized by Chartcraft. The question raised was if a $10.00 unit, three unit reversal chart would be just as appropriate as the $15.00 unit, two unit reversal chart. Not meaning to be glib about it but “WHATEVER WORKS”.
Although the total price range seems identical in the two (2 times $15 is equal to 3 times $10) there is a difference due to the larger unit value required to plot the $15 unit chart versus the $10 unit chart. The $10 unit chart will pick up a greater amount of activity, i.e. filter out less “noise”. A sample of the $10 unit chart is shown here just for comparison.
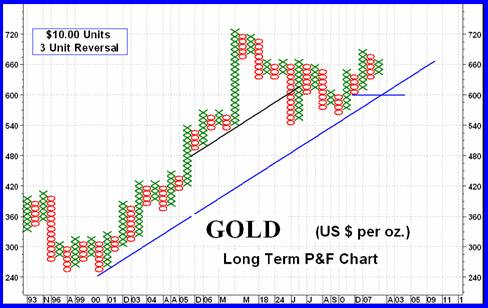
A major difference between the two charts, other than the units and reversal, is the fact that technically the $10 three unit chart has not yet reversed to the bear side as the $15 two unit chart did. Both are once more in sync but this chart would not have issued a bear signal yet. Now, BOTH would indicate a new bear trend if the price should drop to the $600 level. Which chart to use? That's a personal choice, different people will find different charts more to their liking.
As for the normal indicators, well the week's action was still above a positively sloping moving average line, the momentum was still inside its positive zone and the volume activity above its trigger line. All seems bullish but there are warning signs that everything is not yet all that strong to become too comfortably bullish. The major warning comes from the momentum indicator. Although in its positive zone it is not at all very positive.
For the past several months it has been moving mostly sideways just above its neutral line suggesting at best a neutral strength just above the positive. That is, it is not strengthening even as the price has been moving higher over the past few months. One would like to see the momentum strengthening as the price moves higher, or better yet, strengthening ahead of a price move. This is not what we have in the long term chart (daily version). So, although everything is in sync on the bullish side it is still a period of concern.
INTERMEDIATE TERM

There is nothing new on the intermediate term P&F front. Having gone bearish during the March plunge it remains so. However, with the bounce that gold has been going through lately we are very close to reversing that signal. A move to $6.80 would put us back into the bull camp, P&F wise. The recent action suggests difficulty getting further ahead so it may not make $680 this time around.
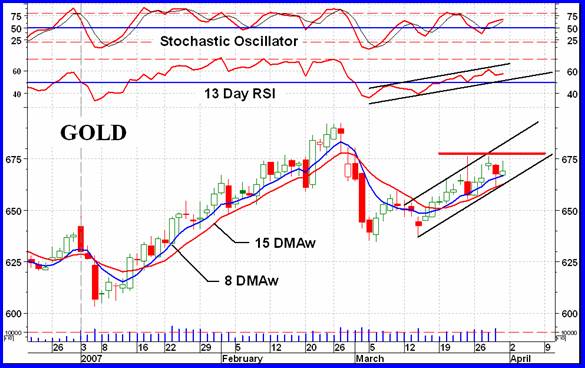
Reviewing the candlestick chart action nothing much has changed here either. The past week has been a blah week, all in all. We are still above a positive moving average line and momentum is still in the positive zone, although very weakly so. Both price and momentum also remain in their multi-month up trending channels. Momentum, however, is very close to the bottom support line and could quickly drop below given a few bad days in the market.
Volume is another interesting indicator. It has been moving sideways, making very little real headway despite the price moving steadily higher lately. Yes, the indicator has moved up into its upper levels but it seems to always come back down to its support level established over eleven months of activity. Despite its quick upward move recently there is no hint that this move has longevity. We'll just have to watch and hope THIS TIME it stays up and continues up.
I'm still hesitant to change my NEUTRAL rating for the intermediate term so will keep it for yet another week.
SHORT TERM
Except for Monday's action, which looked almost like it would go someplace, the rest of the weak was very weak. Yes, I know, gold moved basically higher during the week BUT on every day since Monday the daily activity either closed on the down side or at almost the very low for the days trading range. Closing at the low of a trading range does not cause a great deal of enthusiasm. It is a sign of a weak market. The week's action did take place above the short term moving average line and as long as it does one can say that the short term is still okay. Momentum also continued to move higher although at a more relaxed pace versus previous rallies.
The volume action “looks” okay on a daily chart although I'm not sure how it looks on an intraday chart. With the price moving up but closing at its low point each day I'm not sure during which move most of the volume took place. For now watching the price/momentum moves should keep us on the right side of the short term market. A move to $680 should accelerate activity while a move below the $660 level may also accelerate things but on the down side. For now go with the existing trend, which is still upwards despite the warnings.
IMMEDIATE TERM
Sometimes the short term and the immediate term actions are one and the same. That may be the case here. Although the short term has some strength problems and could reverse within days the trend, as mentioned, is still to the up side. That's what we can see on the immediate term action. The price is still above its very short term moving average line and the line is still positive. The aggressive Stochastic Oscillator continues in the positive zone above its trigger line. Although the SO and its trigger line are converging quite fast they still indicate a positive day on Monday and maybe Tuesday. The coin flip says the same. I'll go with that. Sometimes a 50/50 chance of guessing right is about as good as it gets.
NORTH AMERICAN GOLD INDICES
Well here we are with the AMEX Gold BUGS Index (HUI). As we are aware, the BUGS stand for “ B asket of U nhedged G old S tocks”. The introduction to this Index on the AMEX states “ The HUI Index was designed to provide significant exposure to near term movements in gold prices by including companies that do not hedge their gold production beyond 1.5 years .” Is it only me or is there something wrong with this statement?
A stock Index to provide exposure to near term gold prices??
Companies that DO NOT hedge beyond 1.5 years?? This is considered “unhedged”??
It's an Index of gold stocks and can only provide exposure to the actions of the component stocks relative to the criteria used in the calculation of the Index. Let's not give it any other meaning. We can pretend that the Index does wondrous things but I've seen gold Indices going in the opposite direction to gold prices, especially in the “near term”.
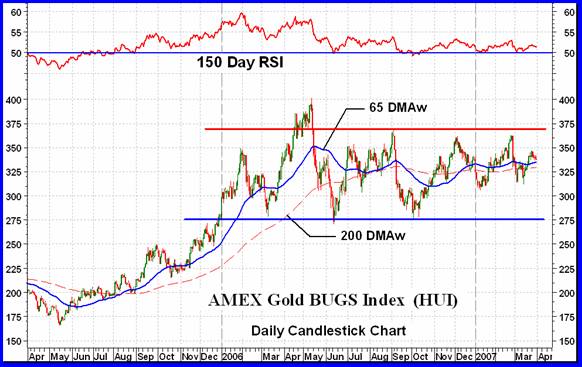
The HUI was last reviewed in the 02 March 2007 commentary. As mentioned at that time, the Index is trapped between a support at the 275 level and resistance at the 370 level. It continues to go nowhere except sideways. The previously mentioned head and shoulder pattern is now getting too long on the right hand side. It might still become an H&S but I will go with other patterns and indicators now.
The lateral trend is seen very well with the actions of the moving average lines, especially the long term average line. They are going nowhere but sideways reflecting the long term nature of the existing trend. The long term momentum indicator is also showing the lateral nature of the action. It has stayed within a 5% band for over 10 months now. Skirting just above the neutral line suggests a very slight positive strength to the move but not enough to make any great transactions based upon it.
One can only call this Index as NEUTRAL for both the intermediate and long term periods. It will be interesting to watch its action once it breaks out of this band, regardless of which way it breaks.
MERV'S PRECIOUS METALS INDICES
All of the Merv's Precious Metals Indices made it into new all time highs recently. All of the other Indices listed in the Precious Metals Indices Table have not yet reached new highs, except for the FTSE Gold Mines AustralAsia Index. This is reflected in the fact that the Composite Index of Gold Indices is still below its previous high and having a rough time getting ahead. The only explanation I can come up with for the differences in performances between the Indices is that all except the Merv's Indices are calculated giving greater weight to the larger component stocks and these few stocks must be doing rather poorly. BUT they are the stocks most individuals and institutions put their money into. Mutual funds and ETFs are loaded with these larger companies and you hear them crying that gold is a bad investment.
MERV'S GOLD & SILVER 160 INDEX
The universe almost made it to the 1% weekly gain level but not quite. It only gained 0.9% on the week. Still when the vast majority of non-Merv's Indices closed the week on the down side I guess one should be happy for small gains.
There are literally hundreds of stocks trading on the North American markets that can be considered as being in the precious metals group, especially gold and silver. My personal directory from which I chose the universe of 160 from has over 700 such stocks. It is therefore inevitable that many great movers are missed. However, focusing on a select list results in a good chance of stumbling upon some winners. The major criteria I have for stocks to be included in this universe is that they have at least a year of active trading history.
The other criteria, well not quite a criteria, more like a preference, is that I include the top 100 gold stocks trading in the North American markets (this is based upon market capitalization at the time of review). These 100 make up the Merv's Gold & Silver 100 Index which is included in the Gold Indices Table but not covered in the commentaries as the commentary against the universe, the Qual and Spec-Indices pretty well cover the 100. No doubt I may have missed stocks that should be included in my universe and more specifically are stocks that should be included in the top 100 list. I welcome notification of any such stocks and will review them during the next universe review which will be sometimes in mid-year.
As for what's happening in the universe, well not much. Nothing has changed from last week. The Index is above both the intermediate and long term moving average lines and both lines are pointing upwards. Both momentum indicators are in their positive zones and both are still tracing more of a lateral path than an upward one. The Table has both time periods rated as POS and I see no reason to dispute that.
As for the breadth of activity, it was almost an even split in the advancing versus declining issues with the advancers slightly ahead with 50% advancing and 46% declining. On the summary of individual stock ratings, nothing much has changed here either this past week. We are still in a NEUTRAL position on the short and intermediate term and slightly in the POS for the long term.
With 160 stocks of all variety this Index is a very good representation of what is happening to the AVERAGE gold and silver stock. For a more refined view of the stocks we go to the sector Indices below.
MERV'S QUAL-GOLD INDEX MERV'S SPEC-GOLD INDEX MERV'S GAMB-GOLD INDEX
Whatever your taste may be in gold investing, speculating or gambling these three sector Indices provide you with a good feel for how that group is doing. Most of the time they may be acting similarly but at times there may be a big difference in their performances. Of these three sectors we see that the higher the “quality” the lower has been the performance in ALL three investment time periods.
Since the Oct 2006 lows the Qual Index gained 22.9%, the Spec Index gained 26.8% and the Gamb Index gained 54.6%. Compare these with the major North American Indices for the same period and you get the BUGS at 15.7%, the PHLX at 10.3% and the S&P/TSX at 13.8%. The reason for the much poorer showing of the major North American Indices is, of course, the method of calculating the Index value. Take the PHLX, the highest weighted stock in the Index is Barrick with a weighting of 17.44%. On an equal weighting it would only have a weight of 6.25%. Its effect on the Index value is 2.8 times what it should be. With a comparable time performance of only 2.1% we can see why the Index under performs the Merv's Indices. It should be noted that the component stocks in each Index performed the same, it's just the Index value that has this slant towards the larger stocks in the major Indices.
Back to the weekly performance, of the three sectors only the Qual Index lost on the week with a 0.9% move lower. Although the number of gainers was slightly higher than the number of losers (50% versus 47%) the losing stocks lost just a little bit more percentage wise than the gainers gained. With a basic neutral week for the stocks nothing much has changed in the technical position of the Indices. The Table just about covers everything this week.
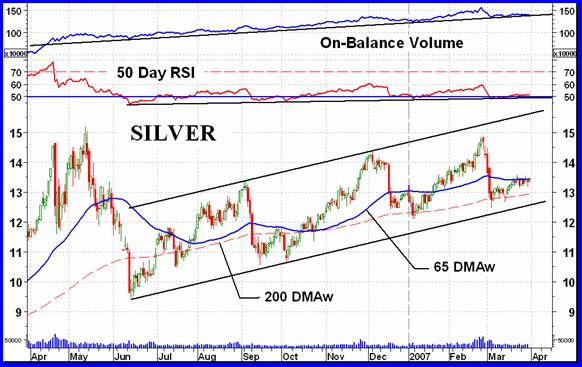
SILVER
Silver continues to move inside its wide up trending channel. Both the volume indicator and momentum are still inside their narrow up trending channels (I have not drawn the upper channel line as it would obscure the indicator). Although the price is somewhat comfortably above its lower support line the indicators are sitting right on top of their support lines. Any negative price action and although the price may stay above its support such negative action would push the indicators below theirs and warn of a trend reversal. Both indicators are warning of a very weak market. We need some sharp and strong upside action to get these indicators back into a strong position otherwise the weakness might cause a trend reversal in the not too distant time.
MERV'S QUAL-SILVER INDEX
Although silver itself gained 1.7% on the week, the Qual-Silver Index went nowhere. Still rated as + N for the intermediate term and POS for the long term in the Table, that sounds about right. A 50/50 split between the weekly winners and losers just goes along with the neutral week. As for the summation of individual stock ratings, they are NEUTRAL for the short and intermediate term and 60% BULLISH for the long term.
MERV'S SPEC-SILVER INDEX
The Spec-Silver Index had the best weekly performance of all the Merv's Indices and the second best of all the Table Indices. It might just be catching up with the other Indices as it was under performing for the past few weeks and still has a short term performance near the bottom of the Table RS ratings. The only real change in the technical position of Spec-Silver this week is in the intermediate term moving average line. Last week it was still slightly pointing lower but has turned up this week. Otherwise, go with the Table ratings.
MERV'S PRECIOUS METALS INDICES TABLE
That's it for this week.
By Merv Burak,
CMTHudson Aero/Systems Inc.
Technical Information Group
for Merv's Precious Metals Central
Web: www.themarkettraders.com
e-mail: merv@themarkettraders.com
During the day Merv practices his engineering profession as a Consulting Aerospace Engineer. Once the sun goes down and night descends upon the earth Merv dons his other hat as a Chartered Market Technician ( CMT ) and tries to decipher what's going on in the securities markets. As an underground surveyor in the gold mines of Canada 's Northwest Territories in his youth, Merv has a soft spot for the gold industry and has developed several Gold Indices reflecting different aspects of the industry. As a basically lazy individual Merv's driving focus is to KEEP IT SIMPLE .
To find out more about Merv's various Gold Indices and component stocks, please visit www.themarkettraders.com and click on Merv's Precious Metals Central . There you will find samples of the Indices and their component stocks plus other publications of interest to gold investors. While at the themarkettraders.com web site please take the time to check out the new Energy Central site for the most comprehensive survey of energy stocks on the internet.Before you invest, Always check your market timing with a Qualified Professional Market Technician
© 2005-2022 http://www.MarketOracle.co.uk - The Market Oracle is a FREE Daily Financial Markets Analysis & Forecasting online publication.