


Gold Powerful 2008 Lessons That Apply Today
Commodities / Gold & Silver 2020 Apr 01, 2020 - 06:35 PM GMTBy: P_Radomski_CFA

Mark Twain said that history does not repeat itself, but it rhymes. It’s certainly true in both life and financial markets. Let’s explore how the recent history lessons apply to the precious metals.
The 2008 - Now Link
Let’s recount the similarities. We already had gold reversing on huge volume, and we saw it decline very strongly in the first week after the top. We already had another attempt to break above that high and we saw it fail. We also saw rhodium at about $10,000. We already saw silver and miners plunging much more severely than gold did. In fact, silver just plunged almost exactly as it did in 2008 during the analogous part of the slide.
All these factors make the current situation similar to how it was in 2008, at the beginning of one of the biggest declines in the precious metals sector of the past decades.
But the very specific confirmation came from the link between gold and the stock market. Stocks plunged along with gold, silver, and mining stocks. That's exactly what was taking place in 2008. The drop in 2008 was very sharp, and silver and miners were hit particularly hard. We expect this to be the case this time as well.
In 2008, the temporary rallies were particularly visible in case of gold, not that much in case of silver, mining stocks, or the general stock market. Gold declined particularly hard only after the USD Index started its powerful rally.
The 2008 decline in the PMs ended only after a substantial (about 20%) rally in the USD Index.
The USDX has just corrected almost 61.8% of its previous decline, and it could be the case that it’s now ready to soar much higher. Last week, we wrote that the USD Index could correct based on the 2T stimulus and other monetary, and fiscal steps taken by the US officials.
That’s exactly what happened. Yet, it’s not likely that these steps will prevent people from raising cash when their fear reaches extreme levels. We’re getting there. And we’re getting there fast.
As the situation is more severe, the USD Index might rally even more than 20%, and the 120 level in the USD Index (comeback to the 2001 high) has become a quite likely scenario.
Let's keep in mind that it was not only the 2008 drop that was sharp - it was also the case with the post-bottom rebound, so if there ever was a time, when one needed to stay alert and updated on how things are developing in the precious metals market - it's right now.
Last week we supplemented the above with description of the 2008 analogy in terms of the shape of the price moves. On Wednesday, we supplemented it with a more detailed time analysis. It’s very important today (and for the rest of the week), so we’re quoting our Wednesday’s comments:
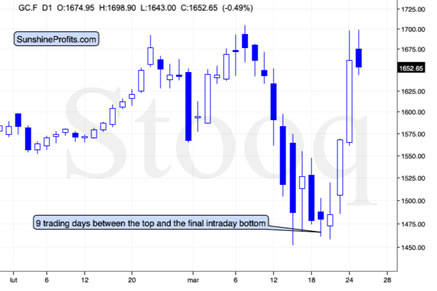
It took 9 trading days for gold to decline from its top to the final intraday bottom, before starting the powerful comeback.
In 2008, it took 41 days. It seems that things are developing about 4.5 times faster now, than they were developing in 2008. More precisely: 41/9 = 4.56 times.
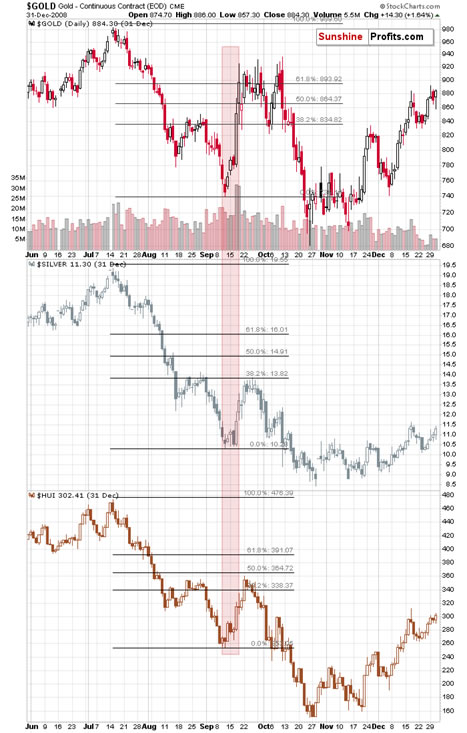
Please note that the decline that preceded the sharp upswing in gold, is also somewhat similar to what we saw recently. There was an initial slide in gold that ended in mid-August 2008, then we saw a correction and then another slide and a bottom in early September. This year, we saw an initial bottom in mid-March, and the final one a few days ago.
Back in 2008, it took 23 trading days for gold to reach its initial bottom and it then took another 18 days for the final short-term bottom to form. 56.1% of the downswing was to the initial bottom, and the 43.9% of the downswing was between the initial and final bottom.
And now? It took 5 out of 9 trading days for gold to reach the initial bottom, and the remaining 4 days were the time between the bottoms. That’s 55.6% and 44.4% respectively.
This is very important, because it shows that the shape of the move is indeed very similar now.
This means that we can most likely draw meaningful conclusions for the current situation based on how the situation developed back in 2008.
Back then, gold moved back and forth close to the initial top. That’s what gold has been doing so far today – which serves as another confirmation for the analogy.
Back in 2008, gold topped over the period of 16 trading days. Dividing this by 4.56 provides us with 3.5 days as the target for the end of the topping pattern since its start. The pattern started yesterday, which suggests that gold could top tomorrow [Thursday, March 26th] or on Friday.
EDIT: That’s exactly what happened – in terms of the daily closing prices, gold has indeed topped on Thursday.
The situation gets more interesting as we dig in more thoroughly…
There are 24 hours in a day. Dividing this by the factor of 4.56 provides us with 5.26. This means that if we could create a chart with 5.26 hour candlesticks, the price moves in gold should be analogous (in terms of how we see them on the chart) to their daily performance from 2008. The closest that we have available are the 4-hour candlesticks.
Let’s check how gold performed recently from this perspective, and compare it to its daily performance from 2008.
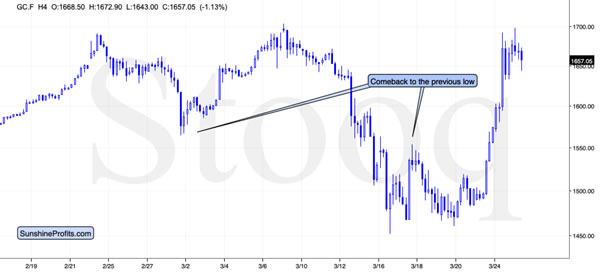
The price moves are remarkably similar.
Even the March 17, 2020 upswing took gold to analogous price level! Gold temporarily topped very close to the previous (Feb 28) low. That’s in perfect analogy to how high gold corrected in late August 2008 – it moved up to the early May 2008 high.
The link to 2008 truly is the key right now.
Ok, so when are silver and miners likely to top?
Sooner than gold.
Please note that both: silver and mining stocks topped more or less in the middle of gold’s topping formation… Which suggests that they should be topping today.
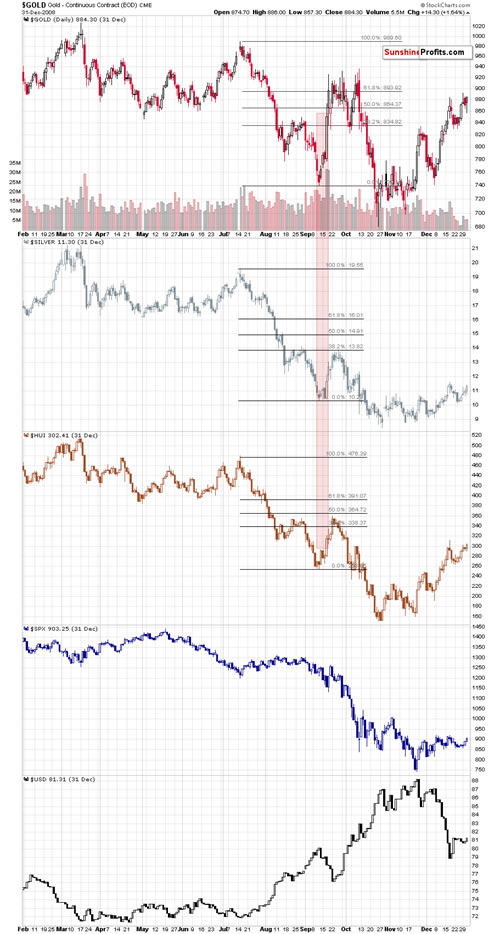
And for the final confirmation – please take a look at what the stock market and the USD Index have been doing at that time. The USD Index was within a pullback while the stock market formed a very short-term upswing. Silver and miners topped along with the stock market.
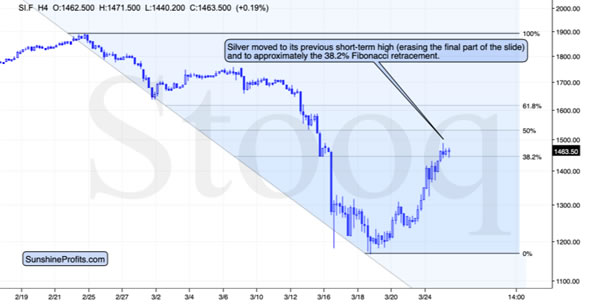
Silver just moved to its previous short-term high (a small high, but the one that preceded the final part of the decline) and it’s approximately at its 38.2% Fibonacci retracement.
That’s exactly where silver topped in 2008. Back then the analogous high was the late-August high, and it also topped close to its 38.2% Fibonacci retracement.
We are probably looking at a top in silver right now.
This means that miners are likely to top today as well.
EDIT: That’s exactly what happened in terms of the daily closing prices. Both: silver and GDX formed the highest daily closing prices on Wednesday – the same day we had published the above.
Please keep in mind that after the 2008 bottom in stocks, it took only two days before they formed an intraday top. Given that this time, the price moves are more volatile, it seems that we could (far from certain) see a powerful reversal (top) as early as tomorrow. This estimate is in perfect tune with the triangle-vertex-based reversal that we see on the GDX and GDXJ charts.
EDIT: Again, that’s exactly what happened. The GDX index formed the intraday high on Thursday, one day after we wrote the above. The GDXJ formed the intraday high on Wednesday.
How much clearer could it get that the precious metals market is re-creating its 2008 slide?
Ok, so what does it tell us going forward?
It tells us that the precious metals market is likely going to slide very profoundly, and very quickly. And it might happen as early as this, or the next week.
Today's article is a small sample of what our subscribers enjoy on a daily basis. They know about both the market changes and our trading position changes exactly when they happen. Apart from the above, we've also shared with them the detailed analysis of the miners and the USD Index outlook. Check more of our free articles on our website, including this one – just drop by and have a look. We encourage you to sign up for our daily newsletter, too - it's free and if you don't like it, you can unsubscribe with just 2 clicks. You'll also get 7 days of free access to our premium daily Gold & Silver Trading Alerts to get a taste of all our care. Sign up for the free newsletter today!
Thank you.
Przemyslaw Radomski, CFA
Founder, Editor-in-chief
Tools for Effective Gold & Silver Investments - SunshineProfits.com
Tools für Effektives Gold- und Silber-Investment - SunshineProfits.DE
* * * * *
About Sunshine Profits
Sunshine Profits enables anyone to forecast market changes with a level of accuracy that was once only available to closed-door institutions. It provides free trial access to its best investment tools (including lists of best gold stocks and best silver stocks), proprietary gold & silver indicators, buy & sell signals, weekly newsletter, and more. Seeing is believing.
Disclaimer
All essays, research and information found above represent analyses and opinions of Przemyslaw Radomski, CFA and Sunshine Profits' associates only. As such, it may prove wrong and be a subject to change without notice. Opinions and analyses were based on data available to authors of respective essays at the time of writing. Although the information provided above is based on careful research and sources that are believed to be accurate, Przemyslaw Radomski, CFA and his associates do not guarantee the accuracy or thoroughness of the data or information reported. The opinions published above are neither an offer nor a recommendation to purchase or sell any securities. Mr. Radomski is not a Registered Securities Advisor. By reading Przemyslaw Radomski's, CFA reports you fully agree that he will not be held responsible or liable for any decisions you make regarding any information provided in these reports. Investing, trading and speculation in any financial markets may involve high risk of loss. Przemyslaw Radomski, CFA, Sunshine Profits' employees and affiliates as well as members of their families may have a short or long position in any securities, including those mentioned in any of the reports or essays, and may make additional purchases and/or sales of those securities without notice.
Przemyslaw Radomski Archive |
© 2005-2022 http://www.MarketOracle.co.uk - The Market Oracle is a FREE Daily Financial Markets Analysis & Forecasting online publication.