


S&P 500 Bulls Again At Resistance – Now What
Stock-Markets / Stock Markets 2020 May 12, 2020 - 05:32 PM GMTBy: Paul_Rejczak

Friday’s key data point were the non-farm payrolls. Horrendous and coming in at minus 20,500K, they surprised on the upside. After their release, stocks continued adding to their overnight gains, closing at the 61.8% Fibonacci retracement. Our previous bullish points turned out correct, but the key question is how strong is this rally? Can it power through this key resistance that is reinforced by the early March bearish gap?
S&P 500 in the Medium- and Short-Run
We’ll start this week’s flagship Stock Trading Alert with the weekly chart (charts courtesy of http://stockcharts.com ):
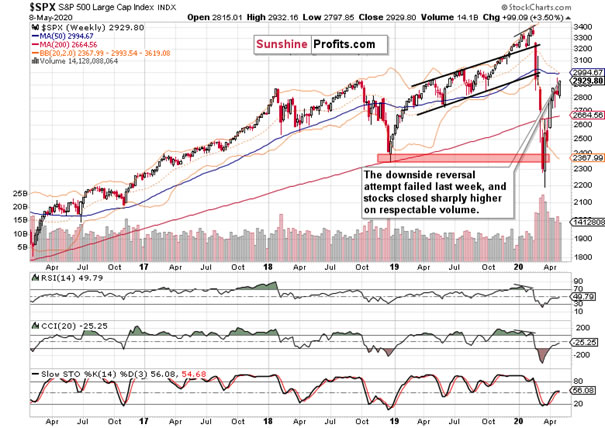
Stocks entered last week’s trading on a weak note, extending previous Friday’s losses in the overnight session to reach the 50% Fibonacci retracement. As Monday progressed however, the bulls cleared off the proximity of this support. The downswing attempt failed, and stocks closed sharply higher last week.
Yes, the weekly indicators are getting tired, but they are still far from flashing sell signals. Importantly, the weekly volume doesn’t show increasing commitment of the sellers, and accounting for the upside momentum, it doesn’t stand in the way of further gains. Apart from the below-mentioned resistances, the 50-week moving average is nearby – can the bulls make it there?
Let’s finetune the perspective on the daily chart.
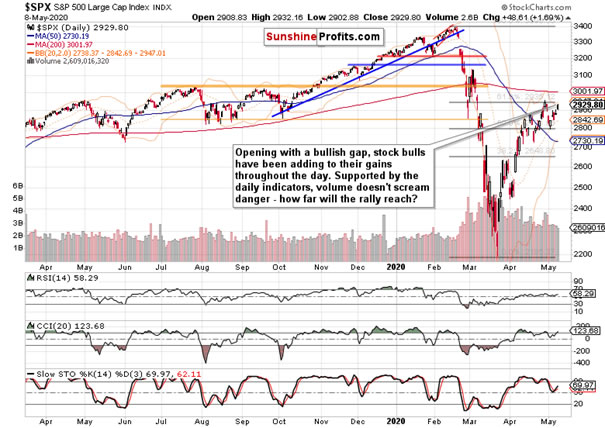
S&P 500 opened on Friday with another bullish gap, and the uptrend continued throughout the day. The daily indicators are still constructively positioned, and the volume is just about right for an upswing. As the stock bulls closed the day at the 61.8% Fibonacci retracement, how strongly positioned are they to overcome the resistance where they failed not too long ago?
These were our Friday’s thoughts regarding the anticipated reaction to the non-farm payrolls:
(…) The point is that stocks have risen like phoenix from the ashes, and continue taking bad news in their stride. That’s what bull markets do, by the way.
Knowing that this hypothesis will be put to test over the coming weeks, let’s dive into the credit markets.
The Credit Markets’ Point of View
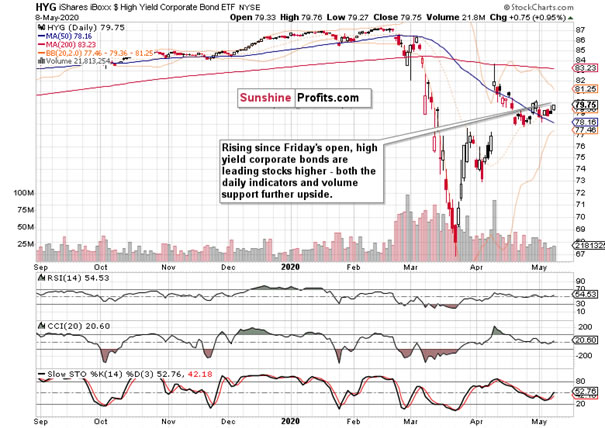
Opening with a bullish gap, high yield corporate debt (HYG ETF) continued leading stocks higher throughout the day. With its late April highs in sight, the daily indicators are in favor of the debt ETF’s upswing to continue. The rising volume coupled with the daily upswing attests to the increasing involvement of the bulls. In short, more upside appears to be the path of least resistance.
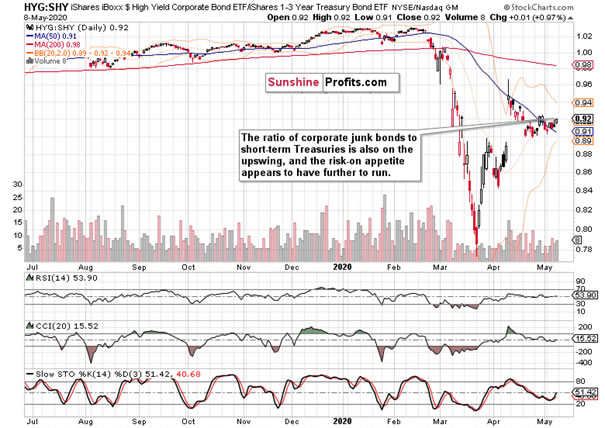
The ratio of junk corporate bonds to short-dated Treasuries (HYG:SHY) is also rising. Again, this shows that stocks are well-bid, and bullish spirits are just there at the moment. In other words, we’re rather in the risk-on than the risk-off environment.
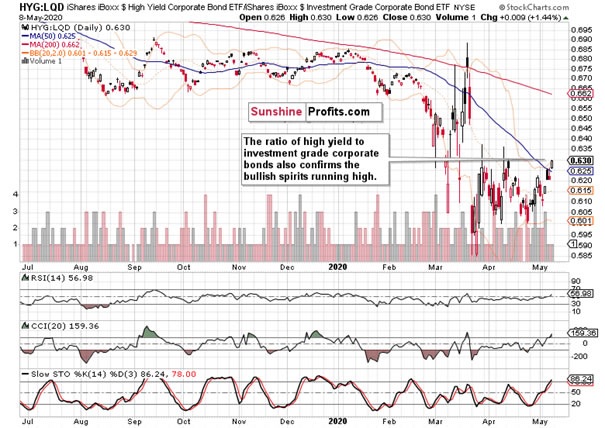
The ratio of high yield corporate bonds to investment grade corporate bonds (HYG:LQD) also supports the above assessment.
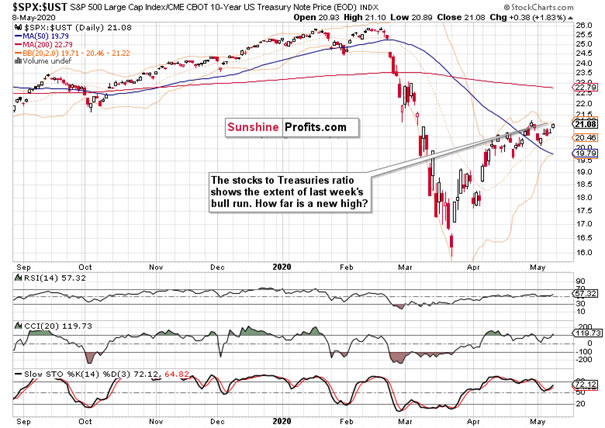
As for the stock market to Treasuries ratio, this metric also reflects the stock upswing. Will it be able to overcome the late April highs? Judged by the credit markets’ performance, it’s not out of the question.
Let’s check the key S&P 500 sectors and their ratios – do they agree?
Key S&P 500 Sectors and Ratios in Focus
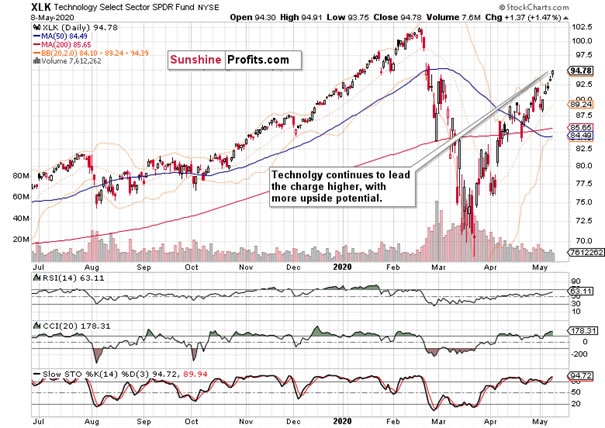
For the fourth consecutive day, the tech sector opened with a bullish gap on Friday. Adding to its opening gains, this leading sector closed solidly up. A word of caution though – while it’s reaching a new highs, Friday’s daily volume could have been higher. As a result, digesting recent gains wouldn’t suprise us in the very short-term.
Despite the risks being still skewed to the upside, let’s remember no market goes up or down in a straight line.
Let’s quote our Friday’s observations as they’re still valid today:
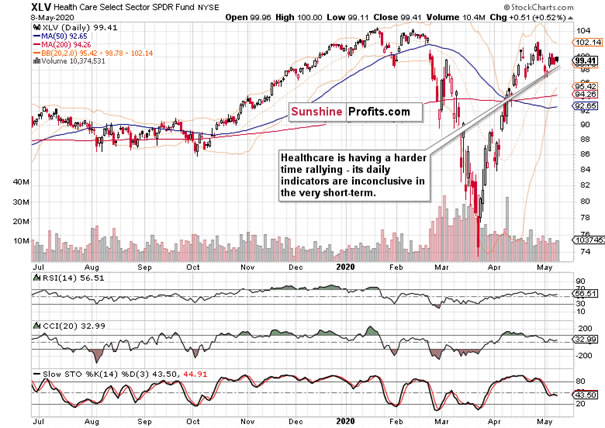
(…) Healthcare (XLV ETF) isn’t performing as strongly, but it isn’t breaking down either. The sector appears just consolidating. Should we see higher volume with yesterday’s candle, that would be bearish – but it wasn’t there. Thus, consolidation appears to be the most probable scenario here.
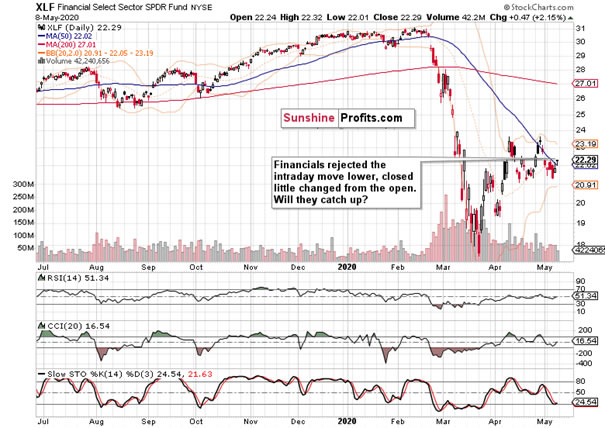
Helped by the rising HYG ETF, financials (XLF ETF) rose on Friday. First though, they had to repel the selling pressure – they did, and closed almost unchanged from their opening prices. It must be said that their performance could have been stronger, but they aren’t moving in perfect daily synchro with the debt markets.
The question is whether they’ll catch up over the coming sessions. Despite the lower daily volume, they can still do that – in late April, we’ve seen similarly low volume coupled with trading not too far from the swing lows, resolved with an upswing.
Let’s move on to the stealth bull market trio of sectors (energy, materials and industrials). Can it be said they’re leading higher?
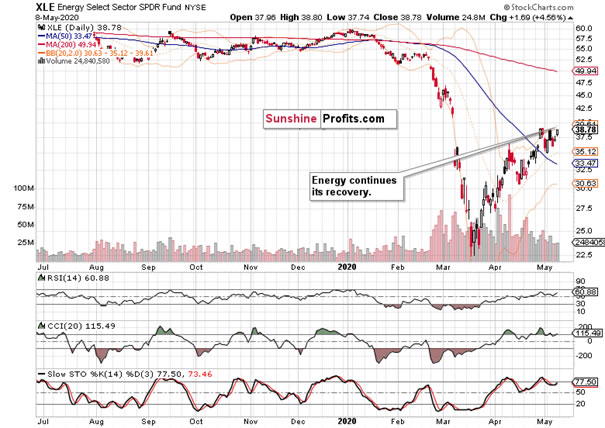
While oil didn’t travel far since Wednesday, the energy sector (XLE ETF) recorded gains over the same period. That’s encouraging, but it hasn’t yet overcome its late April highs. As it’s positioned favorably to take on them, will the upswing attempt be supported by the other two sectors?
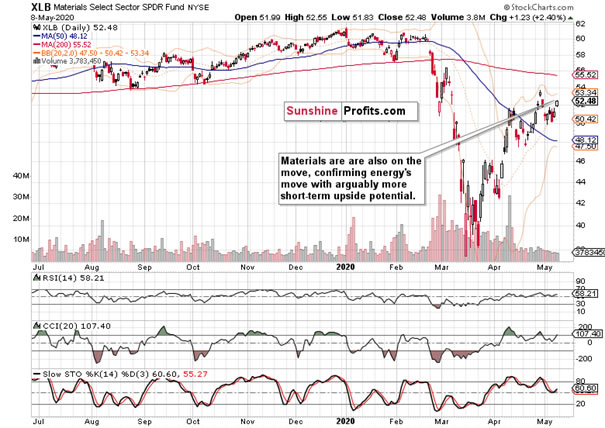
While materials (XLB ETF) also acted strongly on the day, they’re trading below the late April highs. Similarly to financials, there is some catching up to do if the stock bulls aim to move higher still.
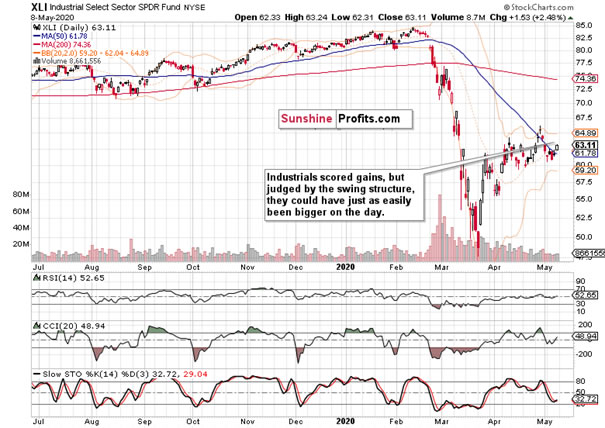
Virtually the same notes apply to industrials (XLI ETF) as well. As a result, unless these three early bull market sectors keep overcoming their Friday’s highs, the S&P 500 is likely to consolidate its recent gains in the short term.
Do the leading ratios support the cautious tone?
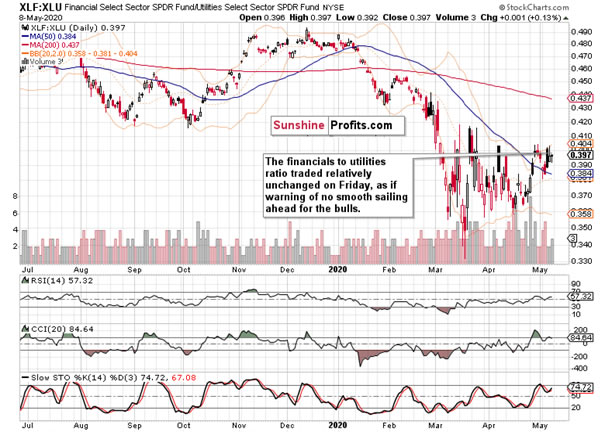
Considering Friday’s strong gains in the index, the financials to utilities ratio (XLF:XLU) could have moved higher. Once it does, the stock advance would be driven more by the risk-on sectors.
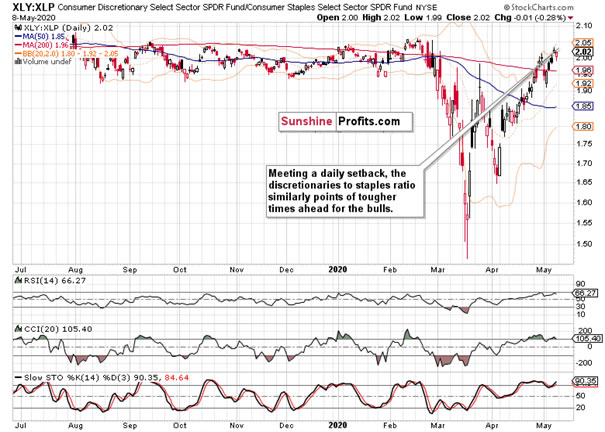
The consumer staples to discretionaries ratio (XLY:XLP) could have also performed stronger on Friday, given the stock upswing. Both of these charts reveal a certain rotation in the S&P 500 – just like the strong performance of defensive tech stocks such as Apple (AAPL) or Microsoft (MSFT) does. Considering that the XLY:XLP ratio has made it back to its February levels already, some back-and-forth moves aren’t (and wouldn’t be) too surprising.
Briefly said, a short-term consolidation of recent gains would be favored by both sectoral ratios. And what about other metrics?
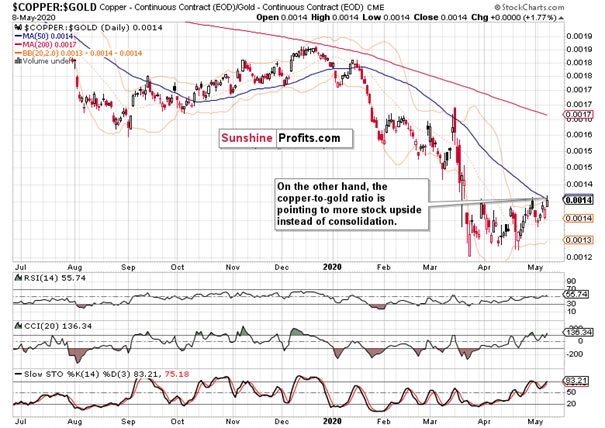
The copper to gold ratio would favor continued stock upside in place of consolidation or downswing. It carries no screaming sell implication just yet. Should it keep trading higher, it would actually help drive materials (and by extension also industrials and energy) up over the coming sessions.
That would be the key element if this S&P 500 rally is to go on. The broader the advance, the better for the prospects of further gains. When we see warning signs of more than a few sectors rolling over to the downside, we would know that the whole index would roll over eventually as well – and sooner rather than later.
With the above in mind, let’s overlay the S&P 500 moves with the key smallcap index, the Russell 2000.
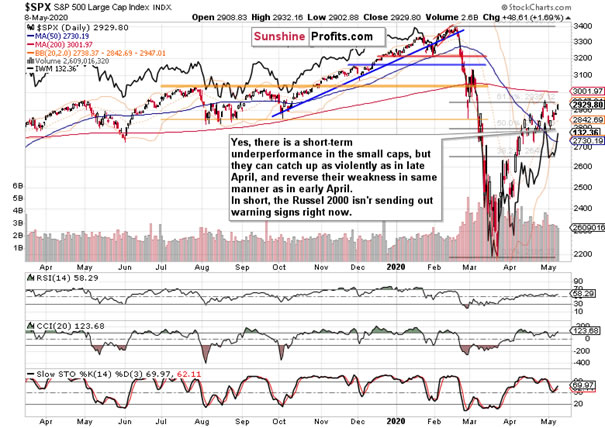
While the two don’t move in perfect lockstep on a day-to-day basis, the Russell 2000 index (IWM ETF) sends valuable signals of either confirmation or non-confirmation of the S&P 500 move over the selected time period.
Having recovered just as steeply from the late March lows, the IWM ETF early April plunge turned out a bear trap. During the stock struggles with the 50% Fibonacci retracement, IWM went sideways, only to spurt higher as stocks raced to the 61.8% Fibonacci retracement. On the stock selloff early last week, IWM made a higher high – that’s a bullish sign of buying pressure returning to the smallcaps.
Should IWM continue catching up relative to the S&P 500 (after all, they haven’t retraced as much of the downside move), that would support the stock upswing to continue – regardless of whatever S&P 500 consolidation we might get over the very short-term.
This works just like the Dow theory or the credit market cues – it’s a process of catching up that shows which way the non-confirmation will be resolved. And such times can take not only weeks, but months. Currently, the IWM signal gives a gentle nod to the bullish camp.
Summary
Summing up, stocks again proved resilient in the face of Friday’s grim employment data. While the key metrics of the debt markets (high yield corporate bonds and its ratios) continue supporting the stock upswing to go on, the stocks to Treasuries ratio spells short-term caution. The message of key S&P 500 sectors is mixed but still with bullish overtones. While we might not see such a strong weekly close this Friday as we did the previous Friday, the risks at the moment continue being skewed to the upside. That would be especially true should the smallcaps continue catching up relatively to the S&P 500. Accounting for the premarket developments (bearish gap and upswing rejection, we’ve already closed the long position and taken respectable profits off the table).
We encourage you to sign up for our daily newsletter - it's free and if you don't like it, you can unsubscribe with just 2 clicks. If you sign up today, you'll also get 7 days of free access to our premium daily Stock Trading Alerts as well as our other Alerts. Sign up for the free newsletter today!
Thank you.
Monica Kingsley
Stock & Oil Trading Strategist
Sunshine Profits - Effective Investments through Diligence and Care
Monica Kingsley is a trader and financial markets analyst. Apart from diving into the charts on a daily basis, she is very much into economics, marketing and writing as well. Naturally, she has found home at Sunshine Profits - a leading company that has been publishing quality analysis for more than a decade. Sunshine Profits has been founded by Przemyslaw Radomski, CFA - a renowned precious metals investor and analyst.
Disclaimer
All essays, research and information found above represent analyses and opinions of Przemyslaw Radomski, CFA and Sunshine Profits' associates only. As such, it may prove wrong and be a subject to change without notice. Opinions and analyses were based on data available to authors of respective essays at the time of writing. Although the information provided above is based on careful research and sources that are believed to be accurate, Przemyslaw Radomski, CFA and his associates do not guarantee the accuracy or thoroughness of the data or information reported. The opinions published above are neither an offer nor a recommendation to purchase or sell any securities. Mr. Radomski is not a Registered Securities Advisor. By reading Przemyslaw Radomski's, CFA reports you fully agree that he will not be held responsible or liable for any decisions you make regarding any information provided in these reports. Investing, trading and speculation in any financial markets may involve high risk of loss. Przemyslaw Radomski, CFA, Sunshine Profits' employees and affiliates as well as members of their families may have a short or long position in any securities, including those mentioned in any of the reports or essays, and may make additional purchases and/or sales of those securities without notice.
© 2005-2022 http://www.MarketOracle.co.uk - The Market Oracle is a FREE Daily Financial Markets Analysis & Forecasting online publication.