


Stock Market Expanding Wedge May Prompt Big Price Correction – Big Top Be Set Up?
Stock-Markets / Stock Markets 2020 Aug 31, 2020 - 05:51 PM GMTBy: Chris_Vermeulen

RESEARCH HIGHLIGHTS:
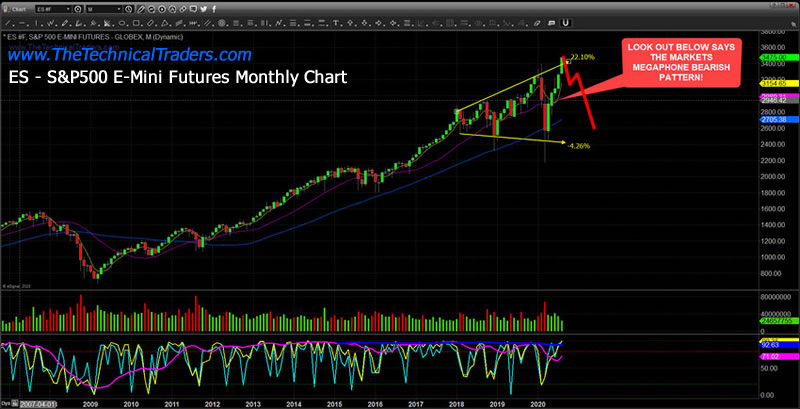
- The Monthly S&P500 E-Mini Futures chart is revealing an Expanding Wedge pattern that has been setting up since Jan/Feb 2018.
- The VIX has set up a base and begun to move moderately higher over the past 7+ days – above the 20.00 point level and above the GAP created by the initial COVID-19 selloff.
- Our Custom Volatility Index chart warns of a “bull trap” set up, and we may see an 11% to 15% (or more) sell-off in the US and global markets if the Custom Volatility Index collapses below 10 over the next few weeks.
- Are These Technical Setups Warning That A Market Top Is Forming?
I want to bring this large expanding wedge pattern to your attention as my research team and I watch the markets continue to push to new all-time highs. This is a follow on to our research from our Special Alert report warning of Head-and-Shoulder patterns in some of our custom charts. We know it may sound a bit alarming to be the one to bring up a potentially devastating Bearish technical pattern at this time, but as technical traders, we must stay aware of risks even if they may not materialize. Trading is a process where we take measured risks in an attempt to generate profits over time. Risk becomes a very big issue if it is not properly managed – just as trading becomes very difficult if one doesn’t learn to take profits in good trades.
LONG-TERM EXPANDING WEDGE RISKS – BE WARNED
The Monthly S&P500 E-Mini Futures chart below highlights the Expanding Wedge pattern that is setting up over the past 26+ months (starting in Jan/Feb 2018). The US stock market has rallied after the COVID-19 virus event to push to new all-time highs – rising above the upper wedge channel. Our researchers believe this pattern may be warning of a potential for a very deep price correction – possibly 11% to 18% or more.
There are a number of other technical setups that are starting to confirm a potential break down. The following Weekly Custom Volatility Index chart shows some very interesting price action this week. First, we want you to pay attention to the Standard Deviation Channels that are drawn on this chart – there are two of them. The longer-term Standard Deviation Channel is sloping higher while the shorter-term Channel is sloping downward. We want you to focus on the downward sloping Standard Deviation Channel and how price has risen to the upper 1x Standard Deviation range (the BLUE LINE) and stalled this week (while the markets continue to push to new all-time highs).
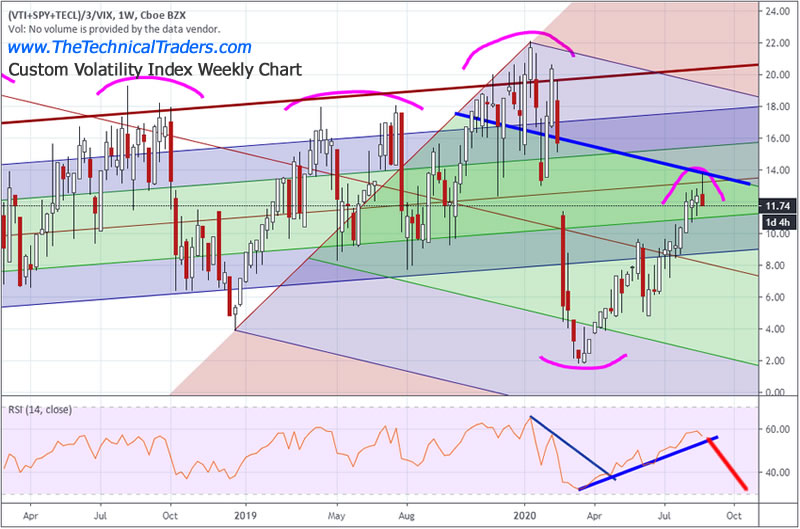
This setup on the Custom Volatility Index chart has our research team concerned that these new price highs may actually be setting up a “Bull Trap” – getting retail and institutional traders to chase the rally, then collapsing into a deep and aggressive downward price trend. If the Custom Volatility Index collapses below 10 over the next few weeks, it would indicate a very strong selling mode has begun where we may see a 11% to 15% (or more) sell off in the US and global markets.
Before you continue, be sure to opt-in to our free-market trend signalsnow so you don’t miss our next special report!
Now, pay attention to the long-term Standard Deviation Channel on this next chart. Notice how the current Volatility Index price level has just recently moved above the MIDPOINT of the longer-term Standard Deviation Channel (the MIDDLE of the Green area within the channel). This “touch-n-blowoff” type of price action suggests price have returned to the MIDPOINT of the longer-term price Std. Deviation range and run into strong resistance. If price is going to continue higher, we would expect this Custom Volatility Index to rally above the 14 level and continue to push higher. Right now, this moderate selloff within the Custom Volatility Index suggests a Peak or Top may be setting up in the markets – suckering in traders as the markets push to new highs on speculative trading in Technology and other sectors.
VIX IS CLIMBING
Lastly, the VIX has setup a base and begun to move moderately higher over the past 7+ days – above the 20.00 point level (above the GAP created by the initial COVID-19 selloff). Our researchers believe the upward price moves in the VIX over the past few days suggest that FEAR is starting to rise again while the US stock markets push to new all-time highs. This suggests that many traders are not comfortable with how the markets are pushing ever higher while economic data and forward concerns still persist. It may be that speculative capital has pushed the US stock market back to new all-time highs while traders chase the Technology Bubble – while more seasoned traders watch and think “what are these people doing chasing these crazy trends”?
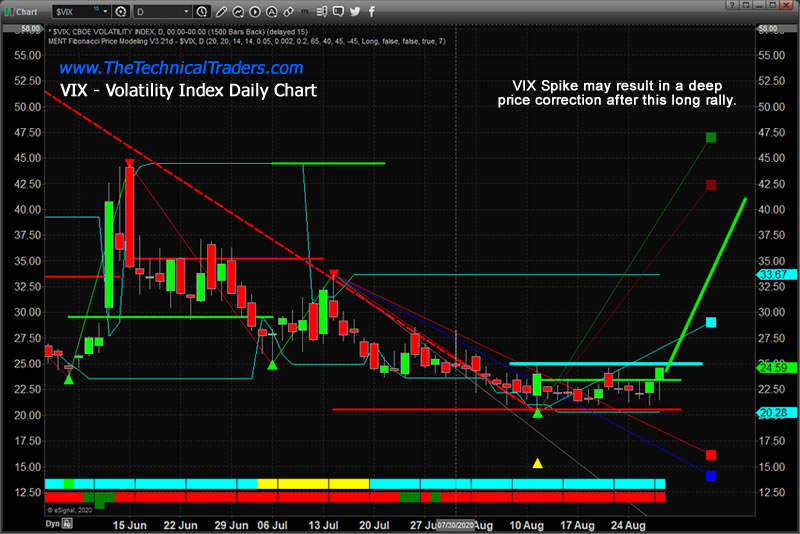
Either way, a spike in the VIX above 25 to 30 would certainly spook the market after we have watched traders pour capital into these new all-time highs. And we believe the potential for the VIX to spike over the next 3+ weeks is substantial given the speed and tenacity of the upward price trend in the US stock market recently.
The upside price rally has been impressive, but is also create a very real risk potential when traders pile into speculative bubbles/trends like this. We’ve been through things like this before in 1999 and in 2005~2007. Look at the size of that Expanding Wedge pattern on the Monthly chart. Being on the wrong side of a 25% downside price correction is not a lot of fun. Be prepared and follow our research.
As a technical analyst and trader since 1997, I have been through a few bull/bear market cycles in stocks and commodities. I believe I have a good pulse on the market and timing key turning points for investing and short-term swing traders. 2020 is an incredible year for traders and investors. Don’t miss all the incredible trends and trade setups.
If you want to survive the trading over a long period of time, then you learn fairly quickly how important it is to protect against risk and to properly size your trades. Subscribers of my Active ETF Swing Trading Newsletter can ride my coattails as I navigate these financial markets and build wealth. My research and trading team are here to help you find better trades and navigate these incredibly crazy market trends.
While most of us have active trading accounts, what is even more important are our long-term investment and retirement accounts. Why? Because they are, in most cases, our largest store of wealth other than our homes, and if they are not protected during the next bear market, you could lose 25-50% or more of your net worth. The good news is we can preserve and even grow our long term capital when things get ugly (likely soon) and I will show you how. We’ve recently issued a Long-term Investment Signal for subscribers of our Technical Investor newsletter. Be sure to become a member of my Passive Long-Term ETF Investing Signals.
Chris Vermeulen
www.TheTechnicalTraders.com
Chris Vermeulen has been involved in the markets since 1997 and is the founder of Technical Traders Ltd. He is an internationally recognized technical analyst, trader, and is the author of the book: 7 Steps to Win With Logic
Through years of research, trading and helping individual traders around the world. He learned that many traders have great trading ideas, but they lack one thing, they struggle to execute trades in a systematic way for consistent results. Chris helps educate traders with a three-hour video course that can change your trading results for the better.
His mission is to help his clients boost their trading performance while reducing market exposure and portfolio volatility.
He is a regular speaker on HoweStreet.com, and the FinancialSurvivorNetwork radio shows. Chris was also featured on the cover of AmalgaTrader Magazine, and contributes articles to several leading financial hubs like MarketOracle.co.uk
Disclaimer: Nothing in this report should be construed as a solicitation to buy or sell any securities mentioned. Technical Traders Ltd., its owners and the author of this report are not registered broker-dealers or financial advisors. Before investing in any securities, you should consult with your financial advisor and a registered broker-dealer. Never make an investment based solely on what you read in an online or printed report, including this report, especially if the investment involves a small, thinly-traded company that isn’t well known. Technical Traders Ltd. and the author of this report has been paid by Cardiff Energy Corp. In addition, the author owns shares of Cardiff Energy Corp. and would also benefit from volume and price appreciation of its stock. The information provided here within should not be construed as a financial analysis but rather as an advertisement. The author’s views and opinions regarding the companies featured in reports are his own views and are based on information that he has researched independently and has received, which the author assumes to be reliable. Technical Traders Ltd. and the author of this report do not guarantee the accuracy, completeness, or usefulness of any content of this report, nor its fitness for any particular purpose. Lastly, the author does not guarantee that any of the companies mentioned in the reports will perform as expected, and any comparisons made to other companies may not be valid or come into effect.
Chris Vermeulen Archive |
© 2005-2022 http://www.MarketOracle.co.uk - The Market Oracle is a FREE Daily Financial Markets Analysis & Forecasting online publication.