


Stock Market Divergent Top - Are Fangs Going To Breakdown Soon?
Stock-Markets / Stock Markets 2020 Sep 06, 2020 - 06:52 PM GMTBy: Chris_Vermeulen

RESEARCH HIGHLIGHTS:
- FANG Index may begin to peak/top as RSI Divergence pattern sets up.
- Dow Theory trend divergence confirmation suggests the end of the “Excess Rally” is near.
- The VIX moving higher suggests greater concerns of increased volatility.
- Dow Jones Utility Index moving lower on increased volume may be the key in a multiple-pattern set up that will confirm larger market trends.
For some context into today’s research article, please review our recent Dow Theory Trending article from last week. We believe the divergent trend between the Dow Jones Industrial Average, the Dow Jones Transport Index, and the Dow Jones Utilities are keys to understanding the current market setup. Today, the Utilities are moving lower with moderately increased volume while the $INDU and $TRAN are both moving higher. We strongly believe we are very near to a peak in the US stock markets based on Dow Theory and the divergent trends between these three indexes.
ARE FANGS GOING TO BREAKDOWN OVER THE NEXT 4 TO 10+ DAYS?
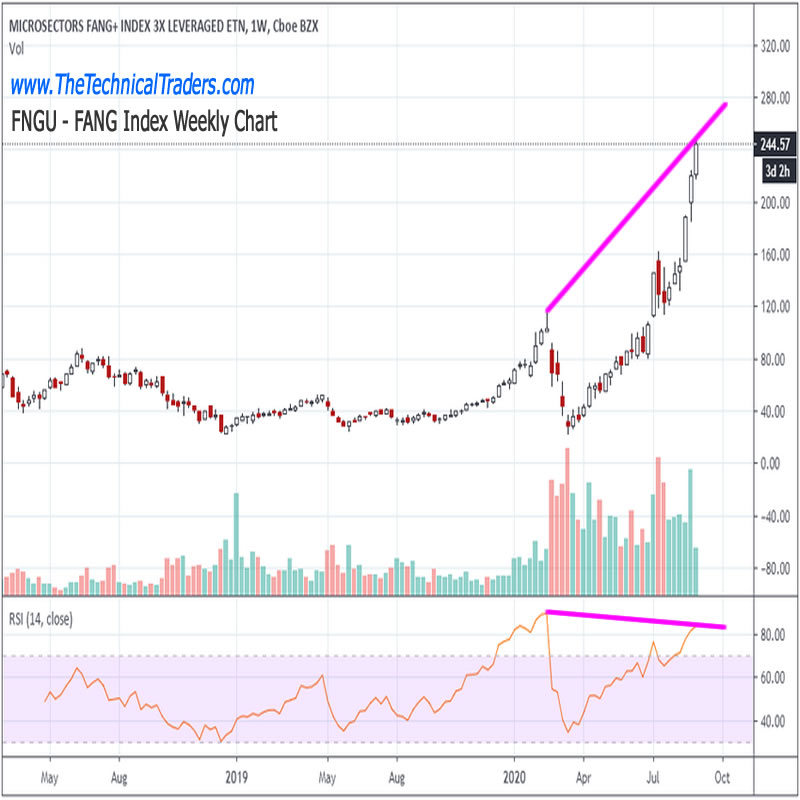
A secondary pattern we are watching closely is the FANG Index Weekly Chart, below. This simple RSI Divergence pattern setup suggests a peak may also be near for the rally in FANG/Technology. Whenever a strong upward price trend exists that fails to deliver a new RSI high level, this is called “technical divergence”. At this point in time, we believe the alignment between the Dow Theory Trend divergence in association with the FANG RSI divergence may be more than a coincidence – it may be tied to the end of an overall “excess rally”.
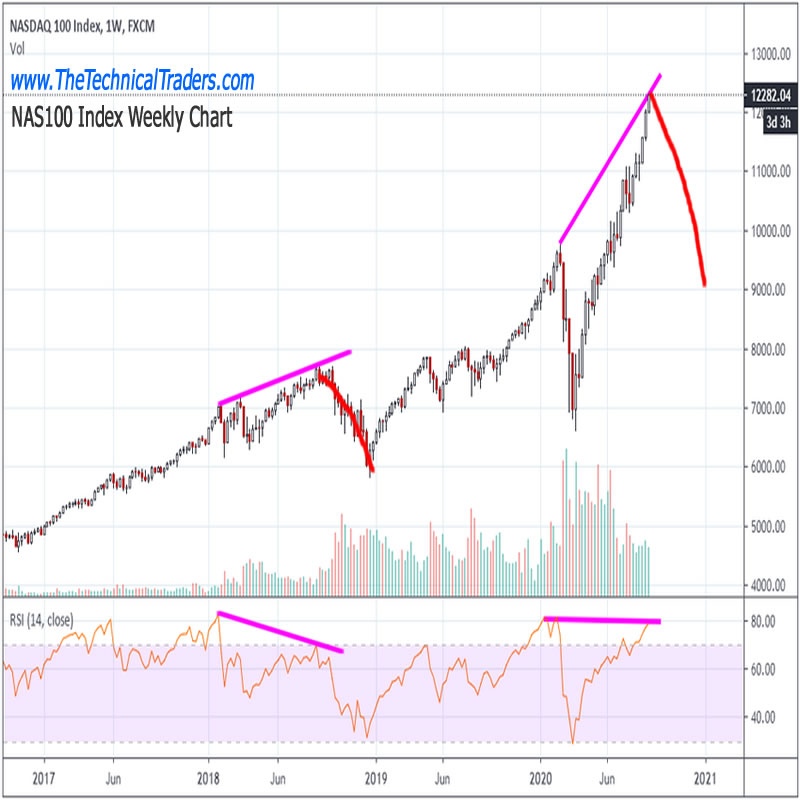
In the following NASDAQ 100 (NAS100) Index weekly chart, we have highlighted past RSI divergence patterns (Tops) to help illustrate how RSI Technical Divergence works. Obviously, we would need to see a breakdown in the upward price trend within the next 5 to 7+ days to better confirm this technical pattern, but the downside move in the Dow Jones Utility Index helps to confirm that the upward price rally in the US stock market is nearing what may become a major peak/top. If our analysis is correct, traders should begin to act to aggressively protect open long positions and watch the Dow Jones Utilities and the VIX for signs of increased risk.
Sometimes these subtle technical patterns align across multiple symbols/instruments to create a much larger pattern. We don’t have any technical confirmation of this setup yet, other than the Dow Jones Utilities falling on increased volume. Our researchers have issued multiple warnings that a peak/top or Head-and-Shoulders pattern appears to be setting up across multiple symbols. We believe traders need to stay very cautious right now. Ultimately, this close to a US presidential election and nearing the end of Q3, we would expect some increased volatility in the markets and a potential correction in this upside price rally. Stay prepared.
Isn’t it time you learned how I can help you better understand technical analysis as well as find and execute better trades? If you look back at past research, you will see that my incredible team and our proprietary technical analysis tools have shown you what to from the markets in the future. Do you want to learn how to profit from these expected huge moves? If so, sign up for my Active ETF Swing Trade Signals today!
If you have a buy-and-hold or retirement account and are looking for long-term technical signals for when to buy and sell equities, bonds, precious metals, or sit in cash then be sure to subscribe to my Passive Long-Term ETF Investing Signals to stay ahead of the market!
Chris Vermeulen
www.TheTechnicalTraders.com
Chris Vermeulen has been involved in the markets since 1997 and is the founder of Technical Traders Ltd. He is an internationally recognized technical analyst, trader, and is the author of the book: 7 Steps to Win With Logic
Through years of research, trading and helping individual traders around the world. He learned that many traders have great trading ideas, but they lack one thing, they struggle to execute trades in a systematic way for consistent results. Chris helps educate traders with a three-hour video course that can change your trading results for the better.
His mission is to help his clients boost their trading performance while reducing market exposure and portfolio volatility.
He is a regular speaker on HoweStreet.com, and the FinancialSurvivorNetwork radio shows. Chris was also featured on the cover of AmalgaTrader Magazine, and contributes articles to several leading financial hubs like MarketOracle.co.uk
Disclaimer: Nothing in this report should be construed as a solicitation to buy or sell any securities mentioned. Technical Traders Ltd., its owners and the author of this report are not registered broker-dealers or financial advisors. Before investing in any securities, you should consult with your financial advisor and a registered broker-dealer. Never make an investment based solely on what you read in an online or printed report, including this report, especially if the investment involves a small, thinly-traded company that isn’t well known. Technical Traders Ltd. and the author of this report has been paid by Cardiff Energy Corp. In addition, the author owns shares of Cardiff Energy Corp. and would also benefit from volume and price appreciation of its stock. The information provided here within should not be construed as a financial analysis but rather as an advertisement. The author’s views and opinions regarding the companies featured in reports are his own views and are based on information that he has researched independently and has received, which the author assumes to be reliable. Technical Traders Ltd. and the author of this report do not guarantee the accuracy, completeness, or usefulness of any content of this report, nor its fitness for any particular purpose. Lastly, the author does not guarantee that any of the companies mentioned in the reports will perform as expected, and any comparisons made to other companies may not be valid or come into effect.
Chris Vermeulen Archive |
© 2005-2022 http://www.MarketOracle.co.uk - The Market Oracle is a FREE Daily Financial Markets Analysis & Forecasting online publication.