UK Government Loses Control of the Coronavirus Pandemic 2nd Wave Forecast Consequences
Politics / Pandemic Oct 01, 2020 - 06:45 PM GMTBy: Nadeem_Walayat
Britains incompetent government has once more lost control of the Chinese Coronavirus pandemic that is now at the very beginnings of a second wave that looks set to be about half as severe as that of March and Aprils first wave in advance of which British Police have been steadily given new powers to accumulate arrest points towards criminalizing people who for instance don't wear masks or are found in groups of 6 or more whilst those who breach self isolation rules could be hit with fines of upto £10,000. Police forces increasingly putting high risk areas and groups of people under surveillance, which translates into ethnic and deprived areas receiving special attention, officers roaming the streets, shops and super markets looking for law breakers with even plans to deploy the army in support of the police towards enforcement of local lockdown's.
p
UK Panic Buying 2.0
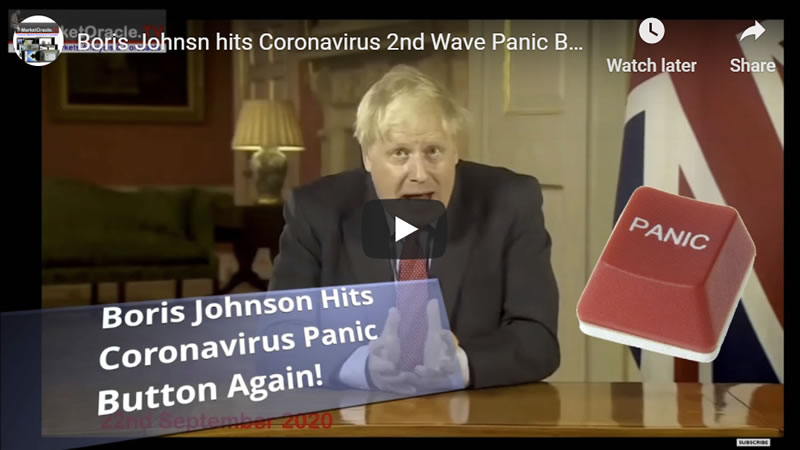
And right on queue panic buying is starting once more across Britain's major supermarkets such as Tesco and Morrisons, who Friday announced restrictions on items purchased on many goods including hand sanitisers, toilet rolls, flour, pasts, baby wipes, antibacterial's and eggs which is likely to spread to many other supermarket goods as the number of local lockdown's multiple in the face of the exponential spread of the virus that has now passed above r 1.5. though hopefully to nowhere near the extent of March panic that this video illustrates of just how bad things could get once more all courtesy of an incompetent government advised by moronic mad scientists hence we cannot blame people for panic buying when faced with morons being in charge!
UK Coronavirus Analysis
The 4 metrics to watch as to extent of the human and economic carnage to expect going into Britain's second pandemic wave are the number of daily cases testing positive, hospital admissions and eventually the delayed figure of the number of deaths both covid and excess that will determine the extent of lockdown panic measures to come.
Who is Spreading the Virus
You only have to venture out to the local supermarket and shopping mall to see why the virus is starting to accelerate once more, for what you tend to see are the rebellious youth i.e. aged 18 to 29 of whom probably less than half are wearing masks, whilst those aged say 30 to 49 whilst more likely to wear masks, many have them below their noses or worse below their chins. Thus defeating the whole purpose of wearing masks in attempts at slowing the spread of the virus.
These observations are born out by the data as the following graph illustrates where those aged 20-29 are the primary population pool sparking the spread of the Britains 2nd wave starting early August and is now in full swing reaching over 60 per 100,000, up foam 15 early August. The next pool of spreaders are those aged 30-39, rising from 15 mid August to 45, pools of infected who are now fast feeding the spread of the virus to the rest of the population as all curves are on an upwards trend trajectory.
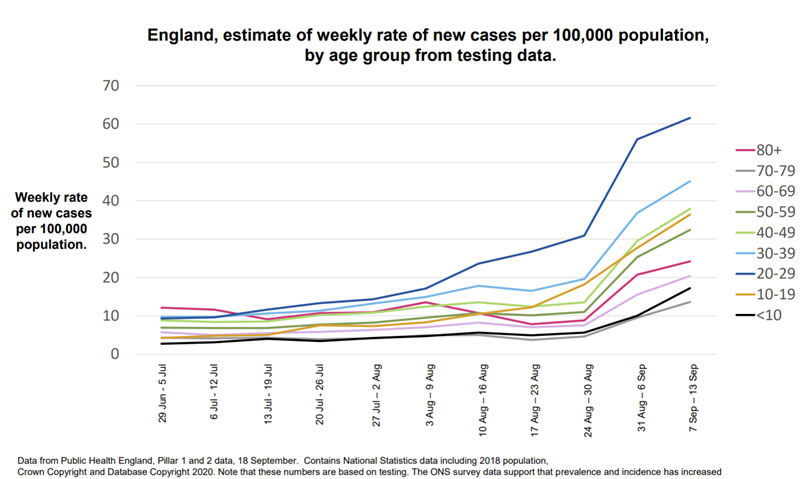
Whilst the very young i.e. the under 14's have proven to be least likely to be instigators of the spread the virus where the number of infections remains relatively low at 17 per 100k, which means whilst the numbers will increase, Britain's schools 'should' remain open in large part during this second pandemic wave. Whilst Universities will remain technically open but are unlikely to be functioning in any manner other than in providing online resources that in most cases cannot compare to what the likes of Youtube already offers in terms of learning materials for free!
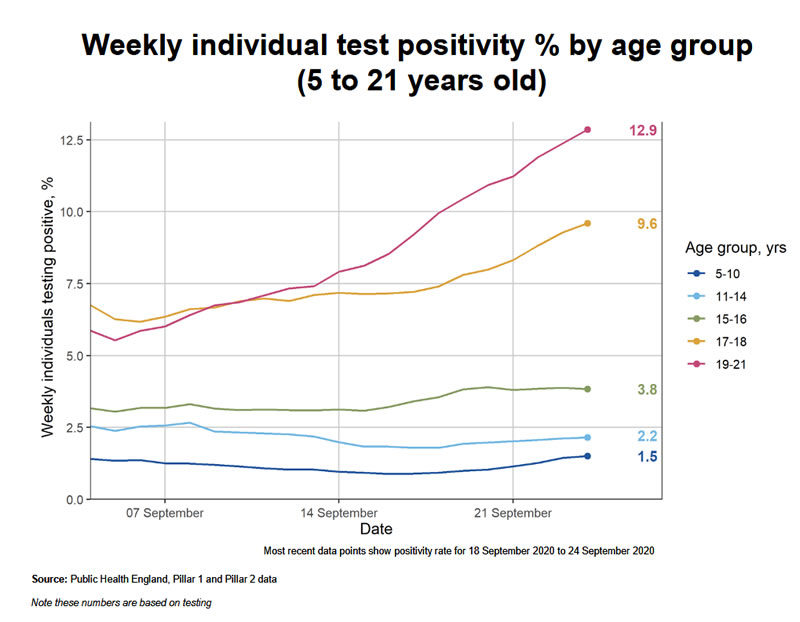
So the primary instigators of Britains second pandemic wave are those roughly aged between 18-40 for not following social distancing and mask wearing guidelines hence the broadcast media being full of bad behaviour when the pubs close, and the plight of thousands of students under lockdown on campuses, though there that maybe by design i.e. get the young infected so as to foster herd immunity. Anyway for most students Universities are a scam.
Covid Hospital Admissions
As you can see by the following graph the UK is nowhere near the magnitude of the first wave, and illustrates the extent of the lack of testing during the first wave as currently some 1,500 people are hospitalised compared to 20,000 at the peak.
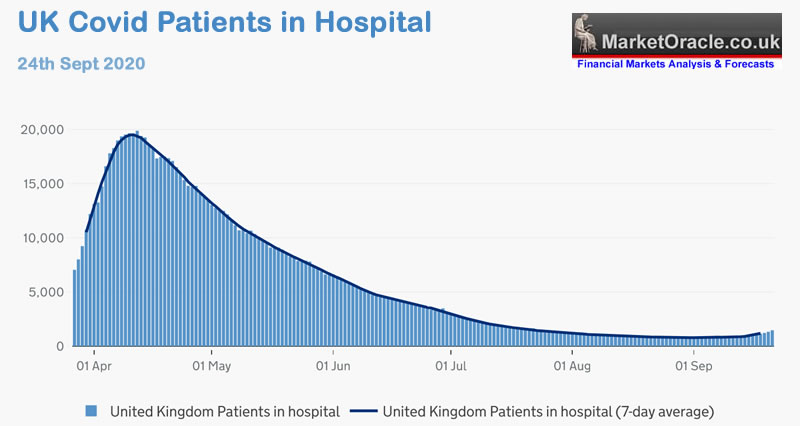
However, unfortunately the second peak could end up being just as high in the number of patients hospitalised as the first wave due to the reason that many people in hospital were dying, so there was a fast turnover in patients, whereas during the second wave a lower death rate will mean the beds being clogged up more with patients.
Covid Deaths 28 Days Since Testing Positive
The only way to reliably measure the extent of the pandemic during the first wave was in the number of deaths, which illustrated the extent to which the government had lost control as the number of daily deaths soared to a peak of 1,224 for the 22nd of April.
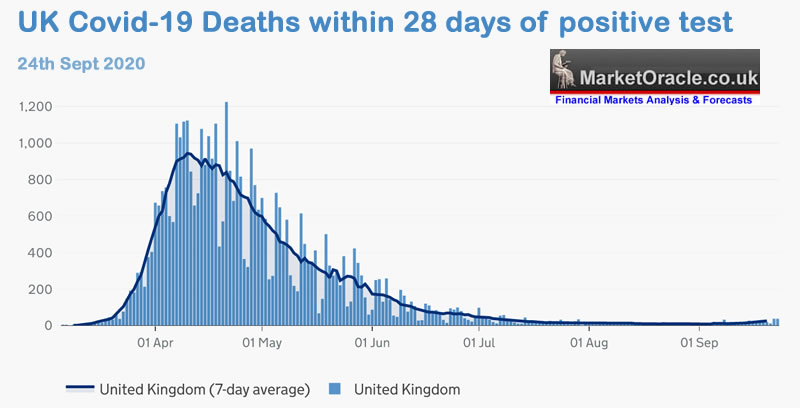
The current number of daily deaths at 37 may seem mild in comparison but so it seemed Mid March when 14 died on the 15th of March. However, the trend trajectory to that point warned of a catastrophe which is precisely where we stand today i.e. deaths per day 2 weeks ago were just 8 per day rising to 37 today which means the UK should brace itself for a huge increase in the death rate to around 1/3rd of tat of the peak of the Pandemic which four weeks from now could easily exceed 400 per day on a best case scenario, worse case reach 600 per day.
UK Excess Deaths
As the pandemic has gone on the government has chosen to CHANGE the methodology used to measure the number of deaths. Where the current method is to measure those who die within 28 days following a positive test for Covid-19 that currently totals 41,862 deaths.
However, it is clear that the official current method results in a substantially lower death toll number than the preceding method which was by means of death certificates listing Covid-19 where the number jumps by 15,000 to 56,956.
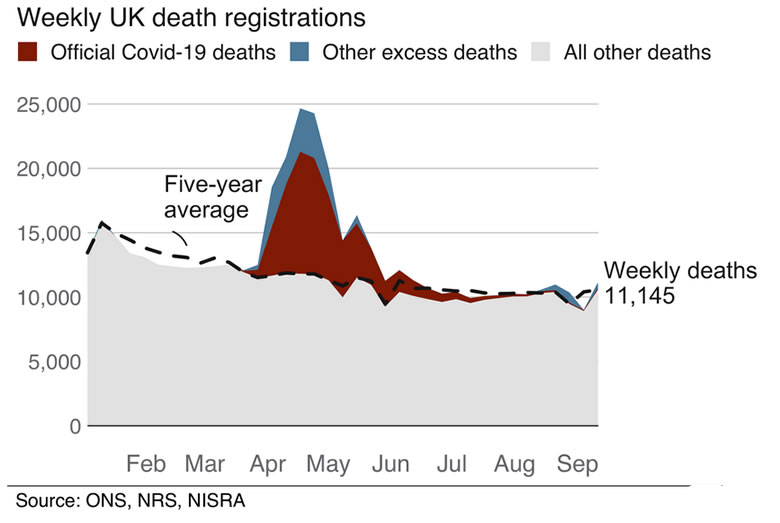
Though even this method under reports the true magnitude of the covid death toll when one looks at the ONS weekly figures in terms of EXCESS deaths above the seasonal average of how many deaths one would normally expect during the course of the year which sees Britains' death tally jump to nearly 65,000.
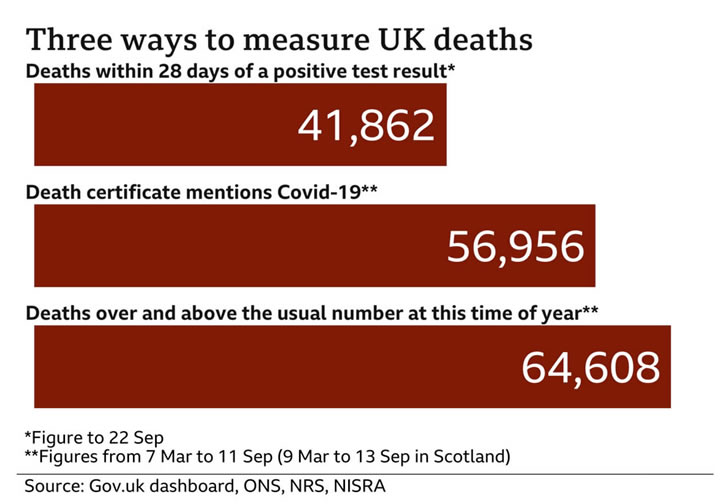
Therefore where deaths are concerned the most reliable metric to watch are the ONS weekly statistics on excess deaths.
UK Daily Cases Forecast
The number of people testing positive has started to soar doubling from 3,000 a week ago to the latest released data of 6,178. Furthermore the ONS estimates that there are approximately 110,000 people across the UK that are infected right now which would imply that the actual number of infected per 100,000 is 168, as against the official figure of of just 40, so four times the official number are actually infected.
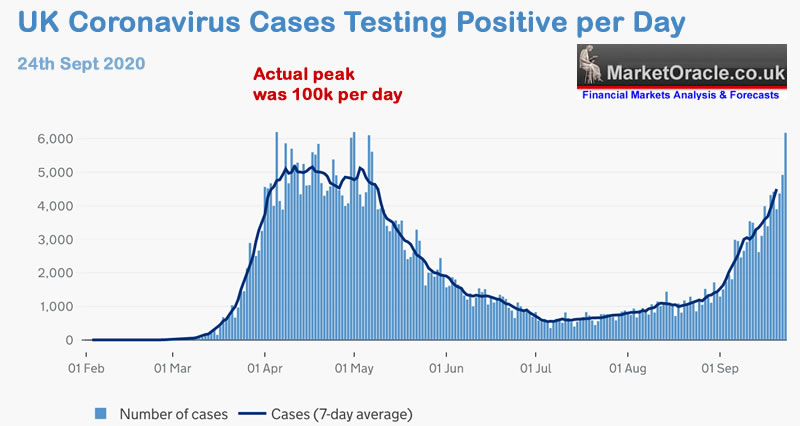
However the current situation is not quite as dire as the above graph suggests for the fundamental reason that as I mentioned earlier barely 1/20th of those infected were being tested during April i.e. only those already ill ending up in hospital were being tested at the time. So during the first pandemic wave as many as 100,000 were catching the virus each day. Though of course NOT everyone infected is being tested right now, probably about half the infected are being tested., so actual number infected per day is around 12,000.
As per my original March analysis I was expecting the second wave to ultimately end up being about half that of the first wave. Which means to expect this wave to peak at just below 50,000 cases per day, say at 42,500 per day, assuming that the first waves peak was at 100,000 per day. Anyway we are likely to see today's official figure of 6,200 positive cases per day increase at least seven fold to about 42,500 per day which given the trend trajectory of doubling roughly every 7 days, though which I expect to slow each week during October as the government issues more lockdown orders and measures across the hot spot regions, thus the forecast number of people testing positive per day by the following dates are -
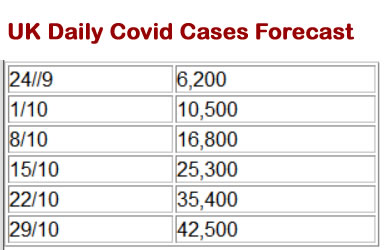
So by late October I am expecting the number of daily cases to be nudging 42,500 before stabilising in response to a series of measures to be announced over the coming weeks as the government effectively panics. Where a deviation against the forecast trend will act as an important advance indicator to expect relative economic strength or weakness.
NEW Lockdown's Economic and Social Consequences
The bottom line there is no imminent sign of a working vaccine this side of the 31st December 2020, so the UK is fast heading into it's second pandemic wave that as per my original Mid March analysis should be roughly half half as bad as the first wave in terms of infections and deaths. This still means as many as another 20,000 extra people could die over the coming months based on the 28 day official measure and thus as will result in the government under taking a series of panic measures in attempts at bringing the pandemic back under control.
Thus we are likely to see extensions and amendments to the governments support measures for the economy such as the furlough scheme that ends 31st October, the most recent of which was Fridays announcement by the Chancellor Rishi Sunak for a new scheme to support viable jobs where workers return to work for at least 1/3rd of their normal hours and the government and employer each cover 2/3rds of the hours not unworked, which effectively cuts government support from 80% to 22%.
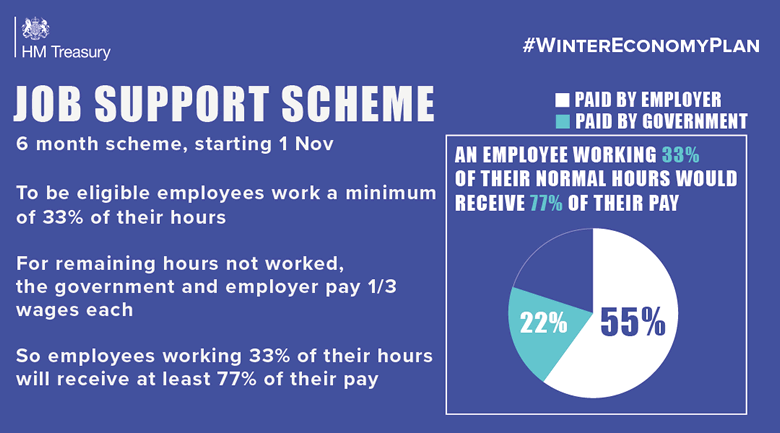
However, the flaw in the chancellors cunning plan is that this scheme places an extra burden on employers who will be expected to pay 22% of the workers full wage, so they could just sack the worker and hire someone else and just pay them for the hours worked i.e. 33% instead of 55%.
Whilst a series of restrictions in social interactions especially amongst regions and population groups who are not abiding by social distancing and mask wearing guidelines, namely those aged between 18 and 40. Thus activities in venues such as as pubs, clubs and restaurants are expected to increasingly be curtailed, as workers are already being urged to work from home rather than to comminute into work. With the restrictions likely to be announced in phases aimed at high infection hot spots rather than a blanket nationwide lockdown.
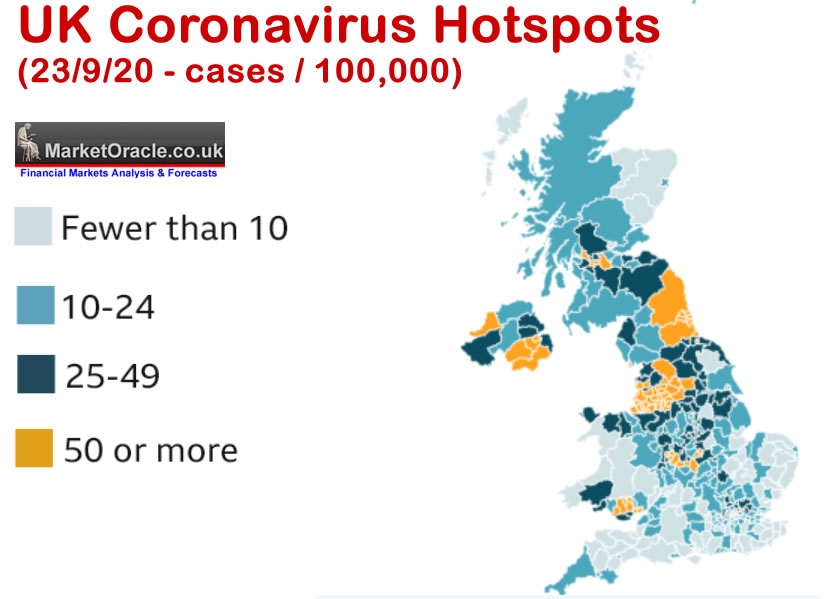
With today only a few regions indicated in orange already under lockdown regimes. Whilst at the same time the government is desperate to keep as many schools open as possible so as to ensure economic activity continues as those parents who have to go into work can do so. Whilst Universities will also remain open though increasingly in name only as students will find themselves stuck in their halls of residence and apartments with few activities taking place on campus as lecturers hide themselves away so as to avoid the risk of infection. Thus by Mid October virtually all teaching will be done online, and even that at a quality less than most people can glean from watching youtube videos, despite this students will be forced to pay the full rate in terms of tuition fees for quality of materials and teaching that barely scrapes 1/10th the value of that which they will actually receive.
Anyway at the least this suggests that the UK is heading for some economic contraction, though which would definitely come nowhere the 23% drop of the catastrophe of the March lockdown given that many business and workers who have not been fully furloughed have adapted to some degree by working around the virus i.e. at home or in better adapted to the virus work places, so whilst UK GDP will probably decline in the quarter October to December, it should be nowhere near the scale of the 20% contraction of April to June, that will likely be followed by a bounce of roughly 14% for July to September, where my best guess is to expect GDP to contract by between 2 to 4% during Q4 the magnitude of which will depends on how bad the second wave actually turns out to be and the resulting government panic measures announced to counter it. Nevertheless it will be no where near as bad as for Q2 and there is even a chance if the government gets an early grip on the Second Wave AND schools remaining open then the UK could even scrape by with positive of 1% to 2% GDP for Q4 2020 given the amount of stimulus I expect the government to be shortly announcing.
And if the UK is representative of much of the rest of Europe than there is the potential for Second Wave to result in upwards economic surprises i.e. the doom and gloom of those expecting even half of the level of contraction of the first wave may not materialise for most economies.
The rest of this extensive analysis that concludes in a detailed trend forecast for the stock market into December 2020. The whole of which is first being made available to Patrons who support my work, So for immediate first access to ALL of my analysis and trend forecasts then do consider becoming a Patron by supporting my work for just $3 per month. https://www.patreon.com/Nadeem_Walayat.
Part 1 - US and UK Coronavirus Pandemic 2nd and 3rd Waves Trend Implications for the Stock Market- Stocks Correction
- The Inflation Mega-trend - The Great CPI Con trick.
- The Corona Depression Second Wave Current State
- UK Government Coronavirus Second Wave Panic
- US Pandemic Presidential Election Forecast Implications
- Dow Short-term Analysis
- Dow Long-term Trend Analysis
- VIX Analysis
- ELLIOTT WAVES
- Dow Stock Market Trend Forecast Conclusion
- AI Stocks Buying Levels Current State
Again for immediate first access to ALL of my analysis and trend forecasts then do consider becoming a Patron by supporting my work for just $3 per month. https://www.patreon.com/Nadeem_Walayat.
And access exclusive to Patrons only content:
How to Get Rich Investing in Stocks by Riding the Electron Wave.
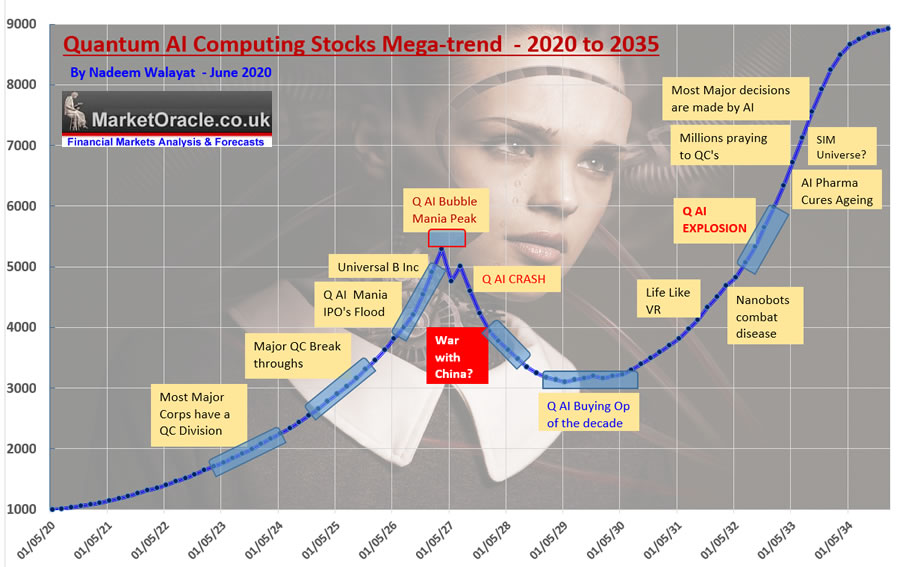
Not to mention trend forecasts such as - Machine Intelligence Quantum AI Stocks Mega-Trend Forecast 2020 to 2035!.
And ensure you are subscribed to my ALWAYS FREE newsletter for my next in-depth analysis.
Nadeem Walayat
Copyright © 2005-2020 Marketoracle.co.uk (Market Oracle Ltd). All rights reserved.
Nadeem Walayat has over 30 years experience of trading derivatives, portfolio management and analysing the financial markets, including one of few who both anticipated and Beat the 1987 Crash. Nadeem's forward looking analysis focuses on UK inflation, economy, interest rates and housing market. He is the author of five ebook's in the The Inflation Mega-Trend and Stocks Stealth Bull Market series that can be downloaded for Free.
 Nadeem is the Editor of The Market Oracle, a FREE Daily Financial Markets Analysis & Forecasting online publication that presents in-depth analysis from over 1000 experienced analysts on a range of views of the probable direction of the financial markets, thus enabling our readers to arrive at an informed opinion on future market direction. http://www.marketoracle.co.uk
Disclaimer: The above is a matter of opinion provided for general information purposes only and is not intended as investment advice. Information and analysis above are derived from sources and utilising methods believed to be reliable, but we cannot accept responsibility for any trading losses you may incur as a result of this analysis. Individuals should consult with their personal financial advisors before engaging in any trading activities.
Nadeem Walayat Archive |
© 2005-2022 http://www.MarketOracle.co.uk - The Market Oracle is a FREE Daily Financial Markets Analysis & Forecasting online publication.


