


How Elliott Waves Simplify Your Technical Analysis
InvestorEducation / Elliott Wave Theory Nov 13, 2020 - 12:28 PM GMTBy: EWI

Here's a key insight into Elliott waves and classic technical chart patterns
First, before we explore a key insight into Elliott waves and technical chart patterns, expect to see a growing number of comments about technical analysis in the financial press.
That is, if a bear market in stocks has started. (The rally over the past few days notwithstanding -- after all, stocks are still well off their highs for the year.)
As a classic Elliott Wave Theorist, a monthly publication which provides analysis of financial markets and social trends, says:
Technical analysis becomes popular in bear markets and loses popularity in bull markets.
For example, the country's first major books on technical analysis -- Technical Analysis and Stock Market Profits (Richard Schabacker) and The Dow Theory (Robert Rhea), were published in 1932. Of course, during that year, the nation was in the depths of a historic bear market.
Now, here in the closing weeks of 2020, some technical analysis references are already being made by some high-profile investment pros.
For example, on Oct. 27, a long-time and well-known global money manager was quoted in a CNBC headline:
Looks like a 'double top' in the S&P 500, [veteran] investor warns
On Oct. 30, Barron's warned:
A double top is bad news. It's a pattern in stock charts that forms after a security or index hits two highs close to one another with a dip in between. It looks like a capital letter M.
Of course, there are many other classic technical chart patterns, both bullish and bearish.
And, the key insight into how Elliott waves relate to these technical chart patterns is this: Elliott waves subsume all of them. This includes the head and shoulders top and bottom, rounding tops and bottoms, triangles, rectangle, double and triple tops and bottoms, diamond, falling and rising wedge, pennant, flag and any other valid technical chart pattern.
Let's pick out just one of them -- the head and shoulders top -- to show an example of how the Wave Principle accommodates classic technical patterns. The commentary is from an Elliott Wave Theorist:
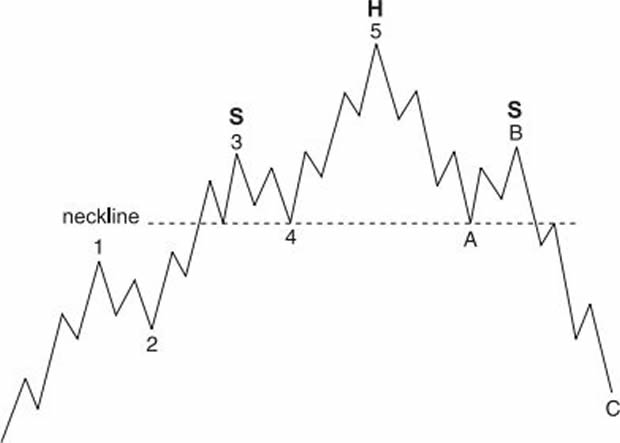
In a normal wave development, wave five of 3 and wave 4 form the "left shoulder" of the pattern, wave 5 and wave A form the "head," and wave B and wave one of C form the "right shoulder." Wave two of C creates the return to the neckline that is typical of the pattern.
In another issue of the Theorist, Robert Prechter approached the subject this way:
Traditional technical-analysis stock patterns, Dow Theory and other descriptions of market form fall within the compass of the Elliott wave model. I think this is an important point, because the Wave Principle can consolidate technical analysis under a single model.
Now, even though the Wave Principle subsumes well-known patterns -- that doesn't mean a technically inclined investor should stop being on the lookout for these patterns.
As the Wall Street classic book, Elliott Wave Principle: Key to Market Behavior, by Frost & Prechter, says:
The Elliott Wave Principle not only supports the validity of chart analysis, but it can help the technician decide which formations are most likely of real significance.
If you want to learn more about the Wave Principle, you can read the online version of Elliott Wave Principle: Key to Market Behavior -- free.
That's right -- this Wall Street classic can be on your computer screen in moments right after you sign up for a Club EWI membership. Club EWI is the world's largest Elliott wave educational community with about 350,000 members and it's free to join. Members get free access to a wealth of Elliott wave insights into financial markets, trading and investing.
Simply follow this link to get started: Elliott Wave Principle: Key to Market Behavior -- free and unlimited access.
This article was syndicated by Elliott Wave International and was originally published under the headline How Elliott Waves Simplify Your Technical Analysis. EWI is the world's largest market forecasting firm. Its staff of full-time analysts led by Chartered Market Technician Robert Prechter provides 24-hour-a-day market analysis to institutional and private investors around the world.
© 2005-2022 http://www.MarketOracle.co.uk - The Market Oracle is a FREE Daily Financial Markets Analysis & Forecasting online publication.