Stock Market Indicators Oversold Suggest Imminent Corrective Rally
Stock-Markets / Stocks Bear Market Oct 18, 2008 - 03:36 PM GMTBy: Marty_Chenard
 This morning we will address two issues: Warren Buffett, and "Is the market trying to establish a short term bottom?
The first is the media hype on what Warren Buffett said about "buying stocks now".
Here are the excerpts of what the media is saying and posting:
"Warren Buffett said he's buying U.S. stocks and, if prices stay attractive, his personal investments, as distinct from his stake in Berkshire Hathaway Inc., will soon be wholly in American equities." ... "Exaggerated concern about the long-term prosperity of the many sound U.S. companies is foolish, and most will probably be setting profit records in years to come, Buffett said."
What very few media outlets are including in his statements is the following:
"Most major companies will be setting new profit records 5, 10 and 20 years from now." He also stated that he had little idea about the short term market direction.
#1: Don't get all excited by the media hype surrounding Buffett's comments. His time frame for being right is extremely long ... 5, 10, or 20 years from now. That is not a time frame that most investors can deal with. Twenty years from now, Buffett and I will most likely not be alive ... maybe I will, but I'd be 81 years old then.
#2: The Bear Market is not over ... we are in the beginning stages of a recession that will go on for months, if not for a year or more . The stock market typically starts its early turn around 3 to 4 months before the market finally bottoms out ... we are not there yet.
Now, let's move to today's chart and analyses ...
This is part of a chart that is posted daily on our paid subscriber site ... there are two additional indicators on our regular daily chart that are not shown.
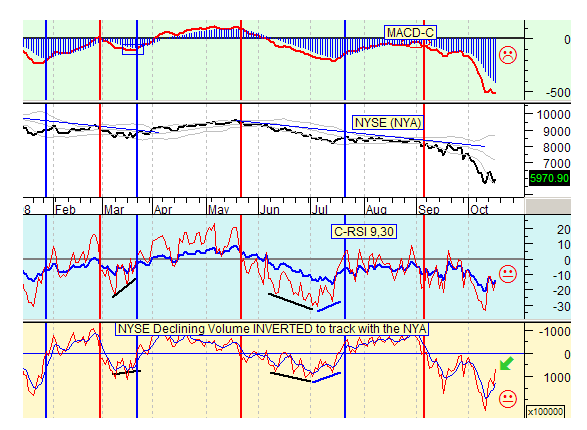
This chart shows our MACD, a Relative Strength of 9 & 30, and the action of trend of the NYSE declining Volume ... all compared to the NYSE Index.
Let's discuss each indicator individually ..
First ... our MACD-C indicator. Note the red line and blue bars. When the red line is below the blue bars, the market has downside weakness. When the red line is above the blue bars, the market has upside strength. There is one important caveat to this ... and that is what is happening to the 30 C-RSI (Relative Strength). If the blue 30 RSI line is BELOW the zero line, then it offsets the upside condition of when the red C-MACD line is higher than the blue bars. In these instances, you normally get a sideways trading range in the market. Take a minute to observe the chart, and you will see that this is the reality.
Next, take a look at the NYSE Declining Volume ... I inverted its trending data so that it would track with the movement of the stock market. When the NYSE Down Volume is below zero and trending lower, more stocks are being sold in terms of aggregate dollar volume. That has a direct correlation to the distribution occurring in the market. Positive NYSE Down Volume correlates with selling pressure coming off of the market.
Currently, the C-MACD has not shown a red line crossing over the blue bars condition, so we haven't reached any safe upside (short term) yet in spite of Buffett exciting many investors about his announcement of "its time to buy".
On the short term, the Inverted NYSE Declining Volume is trending up. This means that the aggregate dollar volume of stocks being sold off is continuing to decrease. This opens up the possibility that the market is now trying to hold a bottom with enough investors having satisfied their selling urges. This creates the possibility for a short term upside bias in the market in the coming days or next week.

______________________________________________________________________
*** Feel free to share this page with others by using the "Send this Page to a Friend" link below.
By Marty Chenard
http://www.stocktiming.com/
Please Note: We do not issue Buy or Sell timing recommendations on these Free daily update pages . I hope you understand, that in fairness, our Buy/Sell recommendations and advanced market Models are only available to our paid subscribers on a password required basis. Membership information
Marty Chenard is the Author and Teacher of two Seminar Courses on "Advanced Technical Analysis Investing", Mr. Chenard has been investing for over 30 years. In 2001 when the NASDAQ dropped 24.5%, his personal investment performance for the year was a gain of 57.428%. He is an Advanced Stock Market Technical Analyst that has developed his own proprietary analytical tools. As a result, he was out of the market two weeks before the 1987 Crash in the most recent Bear Market he faxed his Members in March 2000 telling them all to SELL. He is an advanced technical analyst and not an investment advisor, nor a securities broker.
Marty Chenard Archive |
© 2005-2022 http://www.MarketOracle.co.uk - The Market Oracle is a FREE Daily Financial Markets Analysis & Forecasting online publication.


