


Stock Market Leverage Reaches New All-Time Highs As The Excess Phase Rally Continues
Stock-Markets / Stock Market 2021 Apr 29, 2021 - 02:58 PM GMTBy: Chris_Vermeulen

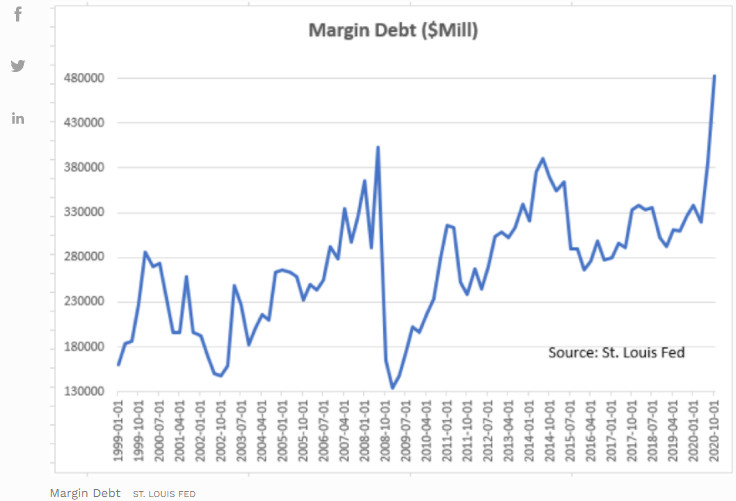
A recent Forbes article highlights the incredible increase in market leverage since the start of the COVID-19 crisis. There has never been a time in recent history where market leverage has reached these extreme levels. Additionally, highly leveraged market peaks are typically associated with asset bubbles.
The easy money policies and global central bank actions have prompted one of the longest easy money market rallies in history. Historically low interest rates, US Federal Reserve and global central bank asset-buying programs, and extended overnight credit support have prompted some traders and investors to move into a more highly leveraged position expecting the rally to stay endless. Although, the reality of the global market trends may be starting to cause traders and investors to become a bit unsettled. Precious Metals, Utilities, and Bonds have all started reacting to perceived fear related to this extended bullish rally trend recently.
My research team and I believe the current market rally will likely continue as capital shifts away from extended market sectors. We believe the transition away from the new US President and the new policies associated with this change of leadership has already started taking place – which is why Precious Metals, Utilities, and Bonds are starting to trend. Yet, we believe the momentum behind this current rally is likely to extend through the end of April and into early May 2021.
Custom Volatility Index Shows Bullish Trending & Price Volatility Risks
Our Custom Volatility Index chart, below, shows the US markets have just recently rallied back to previous bullish market trending levels (above 13 on this chart). Once this Custom Volatility Index reaches these levels, we normally expect two market traits to continue. First, we expect bullish trending because the Volatility Index above 10~11 strongly suggests an extended bullish trend is in place. Secondly, we expect moderate price rotation to take place after the Volatility Index reaches levels above 13~14.
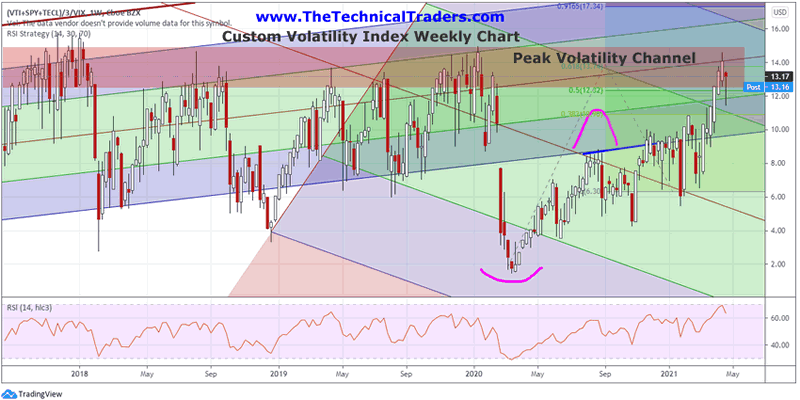
It is very common for the Volatility Index to move above the 13~14 level in extended rally trends. Yet, it is also common for the markets to rotate or retrace after reaching these levels. Therefore, this Custom Volatility Index chart shows the US markets have moved into extreme bullish price trending and has already reached a peak level near 15 – which suggests we can expect some moderate price rotation within the next 3 to 5+ weeks.
Be sure to sign up for our free market trend analysis and signals now so you don’t miss our next special report!
Whenever the US major indexes trend higher in longer-term extended trends, the Custom Volatility Index typically stays above 10~11 and continually attempts to rally above 12~13. The “Peak Volatility Channel” on this chart highlights areas of extreme peaks in the markets. When the Custom Volatility Index reaches this level, price becomes more likely to rotate or retrace a bit before attempting to move higher.
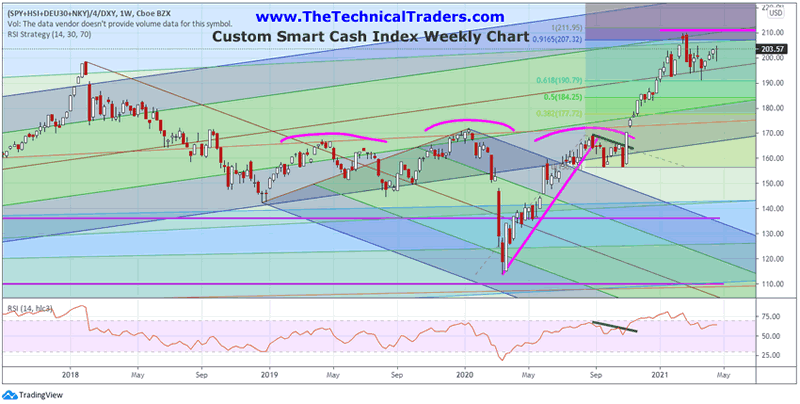
Smart Cash Index Shows Global Markets Need To Break Above 210 TO Begin A New Rally Phase
Our following Custom Smart Cash Index shows the global markets have been struggling to move higher over the past few months. Even though the US markets have attempted to rally to new highs, the Smart Cash Index chart shows this recent rally has not been seen in the global markets.
My team and I believe the next rally phase in the markets must initiate with the Smart Cash Index chart rallying above 210 and representing a moderately strong global market push higher throughout the May/June 2021 time span. If the Smart Cash Index fails to move above the 210 price level, the we believe a moderate price correction may be setting up for May or June 2021 where the US markets may move moderately lower, attempting to retest recent support, then begin another rally attempt.
Currently, the global stock market and financial system leverage may be an unknown catalyst for some type of future market movements. The Forbes article suggests these new all-time high leverage levels are likely the result of global central bank policies where traders and investors believe the central banks will continue to support the markets indefinitely. As much as we would like to think this may be the case, the reality is that, at some point, normalization will take place in the global markets and that presents an ominous deleveraging event in the future.
We are watching how the market’s sectors are shifting trends and how some of the strongest sectors are shifting and weakening over the past 60+ days. For example, the Russell 2000 had been one of the strongest market sectors up until about 2 months ago. Now it appears to be trading in a sideways trend – attempting to move back into a bullish price trend.
Our research team believes traders and investors need to be prepared for quickly shifting sector trends over the next 6+ months as this highly leveraged global market event plays out. Our research suggests a price rotation event is near and the global markets are still trending in a moderately strongly bullish trend. The strongest sectors are going to continue to be the best performers over time. Being able to identify and trade these sectors is key to being able to efficiently target profits. You can learn more about how I identify and trade these sectors by registering for my FREE course here.
For those who believe in the power of trading on relative strength, market cycles, and momentum but don’t have the time to do the research every day then my BAN Trader Pro newsletter service does all the work for you with daily market reports, research, and trade alerts. More frequent or experienced traders have been killing it trading options, ETFs, and stocks using my BAN Hotlist ranking the hottest ETFs, which is updated daily for my premium subscribers.
Chris Vermeulen
www.TheTechnicalTraders.com
Chris Vermeulen has been involved in the markets since 1997 and is the founder of Technical Traders Ltd. He is an internationally recognized technical analyst, trader, and is the author of the book: 7 Steps to Win With Logic
Through years of research, trading and helping individual traders around the world. He learned that many traders have great trading ideas, but they lack one thing, they struggle to execute trades in a systematic way for consistent results. Chris helps educate traders with a three-hour video course that can change your trading results for the better.
His mission is to help his clients boost their trading performance while reducing market exposure and portfolio volatility.
He is a regular speaker on HoweStreet.com, and the FinancialSurvivorNetwork radio shows. Chris was also featured on the cover of AmalgaTrader Magazine, and contributes articles to several leading financial hubs like MarketOracle.co.uk
Disclaimer: Nothing in this report should be construed as a solicitation to buy or sell any securities mentioned. Technical Traders Ltd., its owners and the author of this report are not registered broker-dealers or financial advisors. Before investing in any securities, you should consult with your financial advisor and a registered broker-dealer. Never make an investment based solely on what you read in an online or printed report, including this report, especially if the investment involves a small, thinly-traded company that isn’t well known. Technical Traders Ltd. and the author of this report has been paid by Cardiff Energy Corp. In addition, the author owns shares of Cardiff Energy Corp. and would also benefit from volume and price appreciation of its stock. The information provided here within should not be construed as a financial analysis but rather as an advertisement. The author’s views and opinions regarding the companies featured in reports are his own views and are based on information that he has researched independently and has received, which the author assumes to be reliable. Technical Traders Ltd. and the author of this report do not guarantee the accuracy, completeness, or usefulness of any content of this report, nor its fitness for any particular purpose. Lastly, the author does not guarantee that any of the companies mentioned in the reports will perform as expected, and any comparisons made to other companies may not be valid or come into effect.
Chris Vermeulen Archive |
© 2005-2022 http://www.MarketOracle.co.uk - The Market Oracle is a FREE Daily Financial Markets Analysis & Forecasting online publication.