


The Fed’s inflated cake and a ‘quant’ of history
Commodities / Commodities Trading Jan 09, 2022 - 05:07 PM GMTBy: Gary_Tanashian

A stroll through recent and not so recent inflationary history
[edit] Some wording and a couple typos cleaned up from original post, no changes to themes…
A Cynical Fed is a Dangerous Fed
On ‘Fed minutes Wednesday’ the media amplified the noise, the machines are doing what the machines do and running with it, and it’s all eyes on the great and powerful Fed (of Oz).
The Fed created the cyclical inflation (in NFTRH we detailed and managed the process successfully in real time) and thus the Fed created the cycle. In 2021 the Fed was exposed to the public as the agent of inflation it actually is, and when the inflation threatened to get out of hand they went into damage control mode. Now the Fed is trying to cool the inflation, which means cooling the cycle itself. You can’t have your inflated cake and eat it too. Not when the racket is exposed to the public.
Okay now, that second to last line triggered a memory and sent me to YouTube. Now I have distracted myself with a good laugh.
Moe: “Now look what you did; you deflated it!”
Larry: “Hey, we better blow it up again!”
Moe: “Give it the gas. Larry: “Gas on”. Moe: “Gas on”…. “Gas off!”. Larry: “Gas off”. Moe: “That oughtta be enough…”
Man blows out the candles and BOOM!!!! Classic, and so appropriate.
The media tell us that several Fed members (per the minutes) are “concerned about inflation”, and that they are. I have always said that the Fed is a cynical entity with respect to the inflation it creates. That is because inflation is ultimately destructive to the economy by driving prices up, and to society by widening the gap between the haves and the have-nots. The Fed, being an agent of inflation is also an agent of the haves, who want and to this point get, ever more.
But the deal is this; as you may have seen me note repeatedly, most recently in a post highlighting an excellent piece on US monetary history by Keith Weiner, the Fed is a vampire. What is it they say about vampires? They cannot come into your house unless invited? You – meaning the public, which is always behind the curve – have to invite the Fed into your macro house. This cynical entity needs for something worse than 2021’s inflation fears to disrupt the process before the next inflationary operation can begin. How many times have we seen and managed the inflationary booms and deflationary busts over the last couple of decades? Well, three to be exact.
But an obvious deflationary bust may not and probably will not come on cue.
Today (‘Fed minutes’ Wednesday) was a knee jerk by man and machine alike, reacting to information that was mostly already known. If you are one of the three or four people who were not aware, the Fed is tightening policy. The Fed is starting to take back what it gave, after being so harshly viewed in 2021 for what it had given (some would say inflicted).
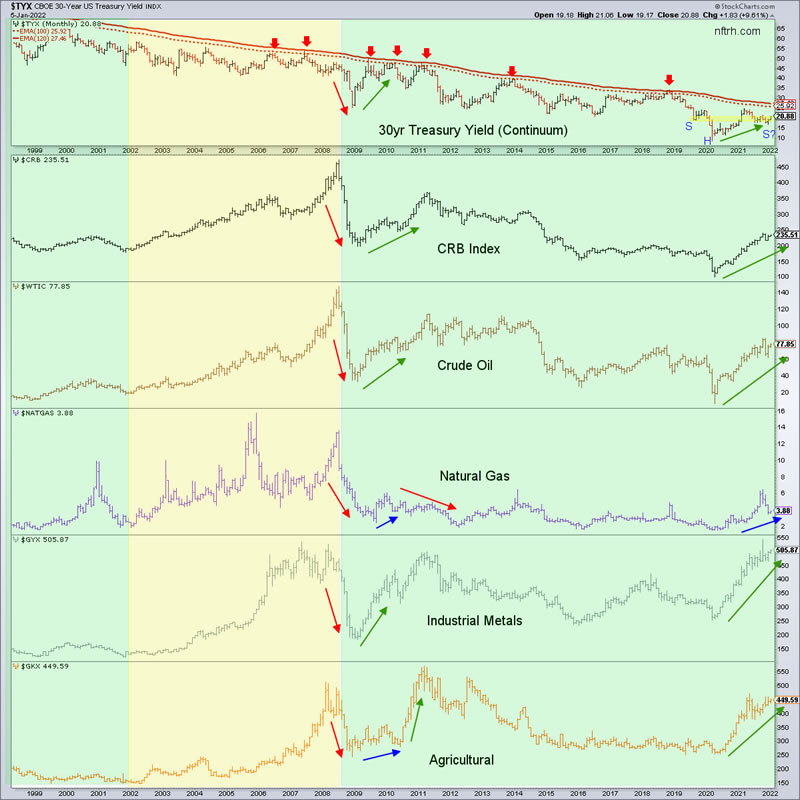
History in Two Charts
First is the 30yr Treasury yield Continuum that we have been managing as an Inverted H&S, which I have to admit I was close to giving up on before the new year’s big burst upward in long-term yields. But here it is, right side shoulder still intact and if it is the guide it has been through its history rising long-term yields would go in generally positive correlation with inflation trades like commodities (along with sectors like Materials and on the current rotation, Value over Growth).
By this picture, if the 30yr yield is to make it to the limiters (monthly EMA 100 & 120) as we had been expecting all along before the recent drop in yields put it in question, the inflation trades are not quite done yet, hawking Fed or not. Indeed, these markets may be preparing to flip the Fed the bird with a dismissive “prove it!” when it comes to tight policy if the correlations to bounces in the yield hold. The other option is that the yield will not reach the limiters and instead fail, as herds fleeing asset markets buy Treasuries (on cue).
There has been so much noise about the Fed’s asset purchase reduction (taper, which is driving long-term yields higher) that it almost seems like the 2yr yield and the short end have been flying under the radar. People think that the Fed decides policy but it does no such thing. The tightening cycle is being driven by the likes of the 2yr Treasury yield.
So what does this chart tell us? It can mean different things to different viewers and I have no claim to call myself an authority. But I can look at lines and correlations. Let’s leave aside the Fed taper issue and long-term yields now and zoom in on the 2yr yield, which is doing what the Bernanke Fed ignored for years before the Yellen Fed finally got the hint in 2015.
All through the Bernanke ZIRP the 2yr inclined albeit in a measured way. But after about 3 years of the 2yr rising the Fed followed with a Fed Funds rate (FFR) hiking regimen as the 2yr started to make some upside noise. I think a sound market manager today would want to respect the idea that aside from bond purchase tapering, the Fed is going to raise rates soon. The 2yr yield says so. Other implications are below the chart.
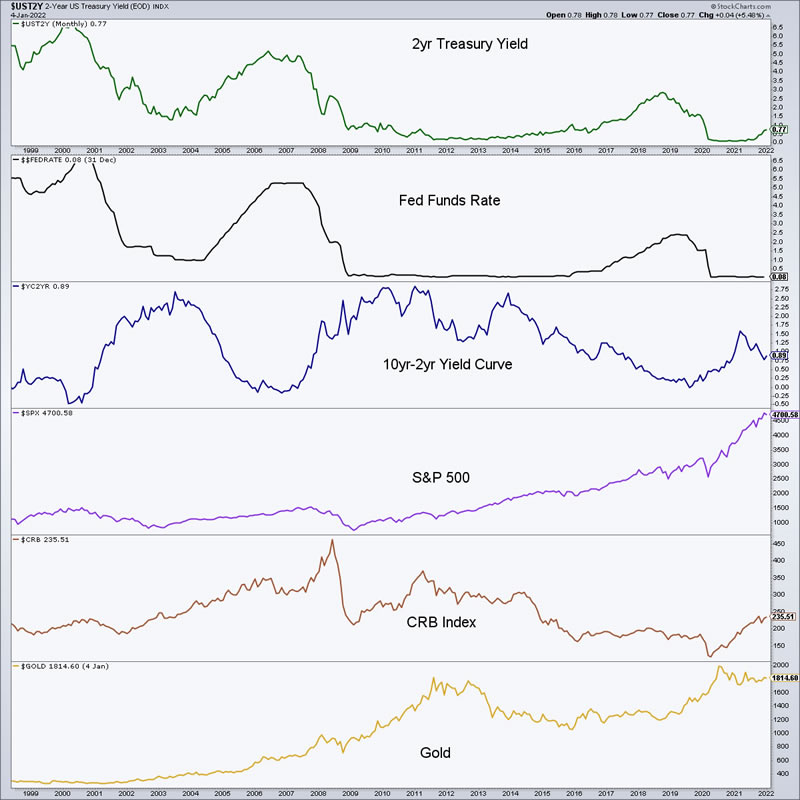
- When the 2yr signaled the FFR to rise in 2004 Alan Greenspan got on it promptly. But the yield curve flattened providing a ‘just right’ signal for stocks and interestingly, both commodities and gold continued their bull markets despite the cooling of inflation signals. Maybe it was just time, considering the 20 years in the desert for these items prior to the bull market.
- It was when the 2yr stopped rising in 2006 that trouble was signaled ahead for stocks and commodities (behold how long it takes for the signals to manifest in actionable moves). The Fed got on the job, aping the 2yr downward and the yield curve steepened in a deflationary bust. Gold, after a little hook down, did what it is supposed to do and provided a liquidity haven amid the mass loss of liquidity.
- The most recent tightening cycle into 2019 saw commodities remain bearish and gold continue under sideways pressure while the yield curve’s Goldilocks flattener was just fine for US stocks on balance. Gold made its bull market move (taking out 1378, which was our long awaited pivot point) around () the time that the yield curve bottomed that summer, well before a certain pain in the ass bug made the scene in early 2020.
- Gold and the risk ‘off’ stuff bulled in H1, 2020 while commodities and stocks dropped.
- Then, with an inflationary steepener on the yield curve commodities and stocks caught on and gold and the 2020 ‘stay/work at home’ trades went into correction, confounding inflationist gold bugs and Cathy Wood believers alike.
Final Observations
To my eye gold is the most bullish looking market on the chart above. A nice, long-term Cup and Handle with the Handle still in construction. But if history is a guide, gold would remain under pressure under threat of the Fed’s tightening cycle. Commodities and stocks would continue upward. I can see a good case for a continued commodity bull but boy that SPX chart looks excessive. I am going to stay open minded on gold and its beautiful big picture chart, but for now it’s just a seasonal bounce (such as it has been so far). [edit, ‘Fed minutes’ hysteria day 2] Gold and especially silver are aborting the bounce.
Okay, let’s not try to solve the whole macro in one public article. Let’s have a laugh at the Stooges and take the macro as it comes. What seems to be coming now is a tightening cycle that will endure until something breaks (or if you will, the macro cake deflates). Then one day the Fed will inflate again.
Meanwhile, ‘Fed minutes Wednesday’ was just noise; noise about what we already knew was in play. The charts above can be confusing because the macro markets can be confusing. What I try to do is distill the messages in various markets and indicators into a sensible ongoing narrative (subject to bias/ego-free revision as needed) in order to help keep NFTRH subscribers (and myself) on the right side of markets in motion and constantly affected by centrally planned policy inputs.
We won’t call every squiggle right but you can bet your bottom dollar we’ll be right with the market’s main themes far more often than not as has been the case since the service launched right into the jaws of the oncoming market crash in 2008. Conveniently, we began the new year with a limited time offer of a 2 week free trial, with no further obligation and not a single string attached. I can’t promise hard bottom line results in any 2 week time frame but I can promise you’ll get a glimpse of a service operating for its subscribers as it should in order to be positioned for coming opportunities.
For “best of breed” top down analysis of all major markets, subscribe to NFTRH Premium, which includes an in-depth weekly market report, detailed interim market updates and NFTRH+ dynamic updates and chart/trade setup ideas. You can also keep up to date with actionable public content at NFTRH.com by using the email form on the right sidebar. Follow via Twitter ;@NFTRHgt.
By Gary Tanashian
© 2021 Copyright Gary Tanashian - All Rights Reserved
Disclaimer: The above is a matter of opinion provided for general information purposes only and is not intended as investment advice. Information and analysis above are derived from sources and utilising methods believed to be reliable, but we cannot accept responsibility for any losses you may incur as a result of this analysis. Individuals should consult with their personal financial advisors.
Gary Tanashian Archive |
© 2005-2022 http://www.MarketOracle.co.uk - The Market Oracle is a FREE Daily Financial Markets Analysis & Forecasting online publication.