


Gold Stocks a Buy!
Commodities / Gold & Silver Stocks Dec 07, 2008 - 09:42 AM GMTBy: Brian_Bloom

 As these words are being written, there are two extraordinarily worrying facts in the world's financial markets:
• There has been a continuing “flight to safety” of capital – as evidenced by a collapse in the 30 year and 10 year yields shown in the charts below (courtesy decisionpoint.com and stockcharts.com respectively)
• There currently exists a backwardation in the gold price. This latter fact was kindly brought to my attention in an email from Professor Antal Fekete. (Note: “Backwardation” means that the price of gold for immediate delivery is higher than the price for future delivery as quoted on Comex. This is the first time in history that this has happened according to Professor Fekete)
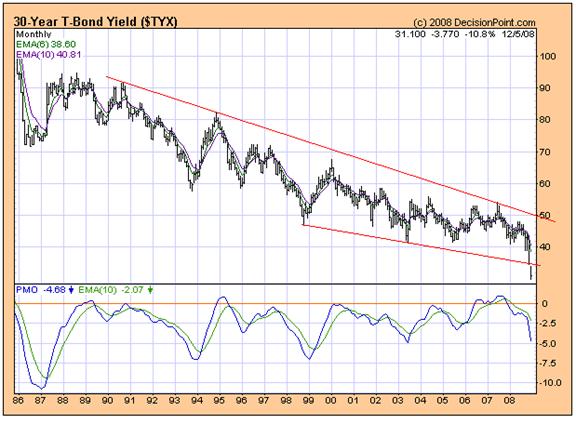
Of course, from a “trading” perspective, one shouldn't get carried away by the two charts above – both of which are seriously oversold. As can be seen from the oscillators on daily chart below the ten year yield is due for a bounce and a similar situation is visible on the daily chart of the 30 year yield.
In context of the above charts, I have to admit that when I first read Antal's argument on backwardation, I thought he had gotten it wrong. It seemed to me that both the collapse in yields and the backwardation in the gold price were signs of coming deflation. After all, it seemed quite logical to me that the most likely explanation of the future price of gold being lower than the current price would be if the market was expecting a fall in prices across the board.
Regular readers will be aware that I have been talking for several months about a slowing velocity of money being the most dangerous economic symptom we might expect. In an article dated February 18 th 2008 (see http://www.marketoracle.co.uk/Article3724.html) I gave the following example:
“The evidence is now mounting that Peak Oil has passed, and volumes of oil throughput being processed by the oil refineries in the West may be contracting. Exxon's volumes contracted very slightly last year and Shell recently announced that its volumes had fallen from the budgeted 3.8 million barrels per day of oil equivalent to 3.315 million bpd
Source: www.dailymail.co.uk/..
…. “the reader's attention is drawn to the simplistic table below, which shows the impact of a price rise from $75 a barrel to $100 a barrel in the markets, and the impact on profitability of an oil business that was previously earning 25% return on revenue, and marks up 75%. In the first case I have assumed sales of 1,000 barrels and in the second case I have assumed that volumes contract by 5%.
Cost Per Barrel $75 $100 Number of Barrels 1000 950 Total Revenue $131,250 $166,250 (*) Assuming 5% inflation |
What this table shows is that, even factoring inflation into the annual expenses, return on revenue rises in both dollar and percentage terms, thereby masking the fall in volume throughput.”
In an article I published the week prior (February 12 th 2008), I had unequivocally called the beginning of the next leg of the Primary Bear Market : “Despite many conflicting signals from many different quarters, this analyst believes we have entered a Primary Bear Market for Industrial Equities.” (See: http://www.marketoracle.co.uk/Article3676.html )
Against this background, when I read Antal's articles on Backwardation I just naturally assumed that it would be explained by an anticipation by the markets of a coming era of deflation.
And then I thought: Hang on a second, Bloom. Antal is an exceptionally bright guy who is careful about the statements that he makes. Make sure you understand exactly what he is talking about before you allow your prejudices to show.
And then I remembered a couple of very odd looking charts that I had seen a few days prior, and the penny dropped. Antal is probably correct.
First, let's understand his argument regarding the most likely reason for backwardation.
My understanding of what he is arguing is that current holders of gold bullion are refusing to part with their gold and that – because of this – Comex is facing a rising probability that it will default on orders for delivery at the end of December or, at the latest, March 2009. For example, if you were a professional trader faced with backwardation, you would naturally sell short now – in the knowledge that you can buy for delivery later at a lower price. But this does not appear to be happening. The reason the price of gold for future delivery is lower, Antal seems to be arguing, is that investors are losing faith in the integrity of the futures market for gold. Investors do not believe that Comex will be in a position to honour its obligations.
This argument is validated by the fact that the Perth Mint – to name but one example – has closed its order book. To quote Mr Ron Currie in an interview published on November 21 st 2008: “…the Perth Mint is not the only producer under pressure. According to the World Gold Council, over the past year worldwide coin sales have increased by 60 per cent, bar hoarding has gone up by 69 per cent while retail spending on gold jewellery has increased by 121 per cent.” (source: http://www.abc.net.au/..)
So, if demand exceeds supply, maybe my deflation explanation doesn't stack up in respect of the gold price Backwardation. If Antal is right about demand exceeding supply then there shouldn't be a Backwardation in Gold there should be a Contango (Future price should be greater than price for current delivery).
Okay. With my mind now open to the possibility that Antal may be correct, I had another look at the charts that were looking so strange to me a few weeks ago. They are all “Relative Strength” charts; courtesy stockcharts.com )
In the week ending November 17 th , the ratio of the 30 year yield and the Standard and Poor Index peaked, and then collapsed – in the process forming a “gap island reversal” formation.
This is consistent with the idea of a coming era of deflation, and is validated by a breakdown in the ratio of the Commodities Index to the Standard and Poor Index (see next chart).
Note the “gap” at point C when the price sliced below the neckline of the Head and Shoulders reversal formation
Okay, so far, everything stacks up: But, if we are heading for deflation, and if gold is just another commodity (as I have been arguing for some time), then we would expect a breakdown of gold relative to the Standard and Poor Index. Well, the fact is that this did not happen and I have long ago learned that one should never argue with facts.
The above is a very interesting chart because the oscillator is showing three non-confirmations with price. E is lower than D whilst B is higher than A; F is higher than E whilst C is lower than B; and F is lower than D whilst C is higher than A.
On balance, the technicals show that the gold price has probably peaked relative to the Industrial Index – for the time being – and is also unlikely to collapse relative to Industrials
Of considerable interest, this is not consistent with the argument which expects a coming era of deflation and argues that gold is just another commodity. Something seems to have changed.
What has changed is the relationship of gold shares to the gold price – as can be seen from the Relative Strength chart below.
This is a very important chart, in my view, in that it is signaling a possible change in the way the market is perceiving gold. Yes, the gold price may have peaked relative to the Industrial markets for the time being, but Professor Antal Fekete may be dead right! One reason the gold price seems to be wallowing may be that the normal market processes may be breaking down.
AND IF THE MARKET IS EXPECTING GOLD TO BECOME MORE VALUABLE – BUT GOLD BULLION ITSELF CANNOT BE ACQUIRED – THEN THE NEXT BEST THING WILL BE TO BUY GOLD SHARES!
That may be why the gold shares are looking like they want to strengthen relative to gold.
The picture becomes somewhat clearer when we look at the ratio of the $XAU to the gold price on a 3% X 3 box reversal Point and Figure Chart (courtesy stockcharts.com )
Note how the ratio gave a tentative buy signal when it reached 12.41.
Note also the bullish non confirmation on the chart below – where the oscillator has reached a higher high than C – at point D – whilst the high on the chart at point B is lower than point A.
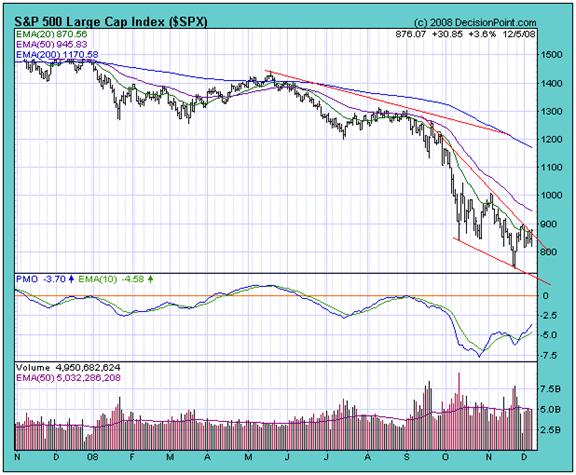
Finally, we need to look at the Standard and Poor Industrials Index by itself. Is this also oversold and due for a bounce – as are the yield charts?
The short answer – based on the following daily chart (courtesy decisionpoint.com ) is “yes”. Note the non confirmation of the PMO oscillator and the price
Conclusion
Whilst the “investor fear” that has been manifesting over the past few weeks seems likely to recede temporarily in both the Bond Markets (yields may bounce) and the Stock Markets; and whilst the downward trend in both yields and equities is presaging a possible emergence of deflation – something sinister may be happening behind the scenes: The gold market may be about to become dysfunctional.
This potential dysfunctionality is being evidenced by Backwardation in the gold price and the market appears to be sensing this possible dysfunctionality by shifting its emphasis to focus more intently on gold shares. If this happens, it will be the first time since 2005 that gold shares will have outperformed the gold price. In an environment where many other technical indicators are pointing to potential deflation – as validated fundamentally by a slowing in the velocity of money – the potential relative strength of gold shares to gold is a very significant development. Professor Fekete may well be correct in his assessment that “ Central banks have stopped feeding the market with gold sales and leases.”
Overall Conclusion
My personal view (not a recommendation) is that it will make sense to buy shares in well capitalized gold mines which do not have forward delivery commitments .
By Brian Bloom
Beyond Neanderthal is a novel with a light hearted and entertaining fictional storyline; and with carefully researched, fact based themes. In Chapter 1 (written over a year ago) the current financial turmoil is anticipated. The rest of the 430 page novel focuses on the probable causes of this turmoil and what we might do to dig ourselves out of the quagmire we now find ourselves in. The core issue is “energy”, and the story leads the reader step-by-step on one possible path which might point a way forward. Gold plays a pivotal role in our future – not as a currency, but as a commodity with unique physical characteristics that can be harnessed to humanity's benefit. Until the current market collapse, there would have been many who questioned the validity of the arguments in Beyond Neanderthal. Now the evidence is too stark to ignore. This is a book that needs to be read by large numbers of people to make a difference. It can be ordered over the internet via www.beyondneanderthal.com
Copyright © 2008 Brian Bloom - All Rights Reserved
Disclaimer: The above is a matter of opinion provided for general information purposes only and is not intended as investment advice. Information and analysis above are derived from sources and utilising methods believed to be reliable, but we cannot accept responsibility for any losses you may incur as a result of this analysis. Individuals should consult with their personal financial advisors.
Brian Bloom Archive |
© 2005-2022 http://www.MarketOracle.co.uk - The Market Oracle is a FREE Daily Financial Markets Analysis & Forecasting online publication.
Comments
|
John G
10 Dec 09, 17:45 |
gold investment
Analyst Report coming on VHGI Gold (OTCBB VHGI) |