


China's Stock Market and the Baltic Dry Index
Stock-Markets / Chinese Stock Market Dec 10, 2008 - 08:02 AM GMTBy: Richard_Shaw

 China stock market and Baltic Dry Index are in current disagreement.
China manufactures things and ships them around the world. Much of that transport is done by sea. The Baltic Dry Index is an assessment of the price of moving major raw materials by sea.
As global trade increases, the Baltic Dry Index tends to increase. As global trade decreases, the index tends to decrease. The number of cargo ships can and does fluctuate to moderate swings in the index, but not rapidly. That makes the Baltic Dry Index a useful tool to view global trade (and to a great extent the Chinese export economy) in a single indicator.
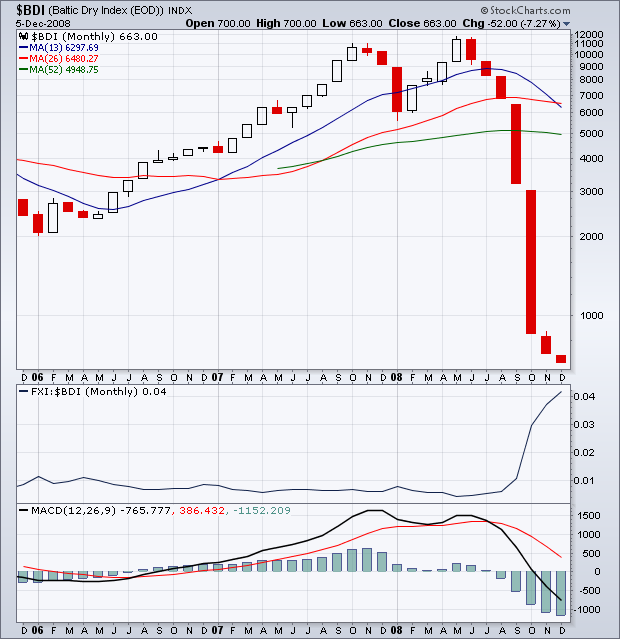
The following Baltic Dry Index chart shows the index collapsing in the last 6 months. However, FXI (the China ETF) did not fall nearly as much, resulting in the rising relative performance shown in the middle panel of the chart. Both FXI and the Baltic Dry have been declining, but the shipping price index has fallen farther than the the FTSE/Xinhua 25 index that FXI tracks.
The question arises, “could they both be right”? Maybe, but maybe not.
3-Year Monthly Baltic Dry (with FXI relative performance)
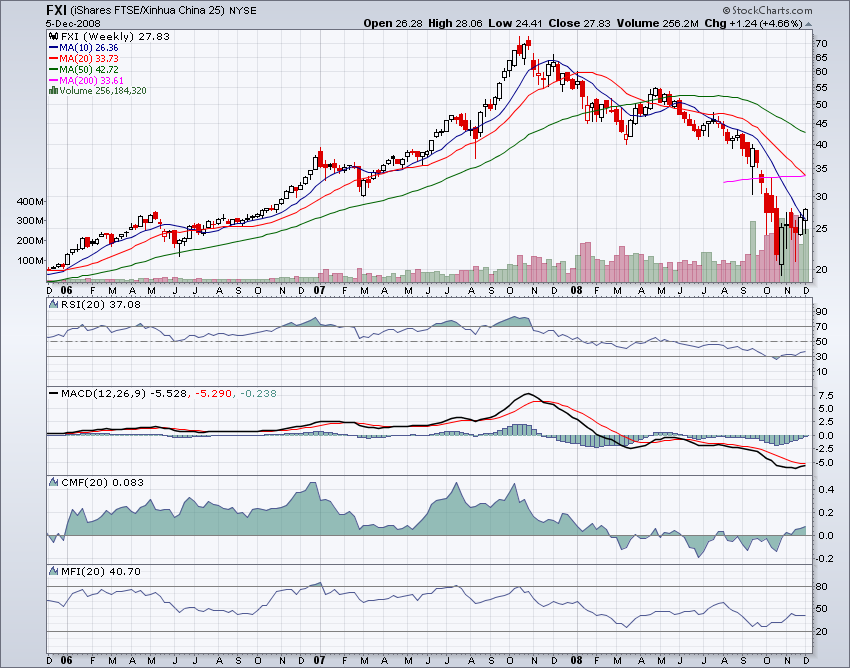
The three-year chart of FXI shows a large drop, but the most recent period raises questions about a possible rally that writers and traders are discussing.
3-Year Weekly FXI
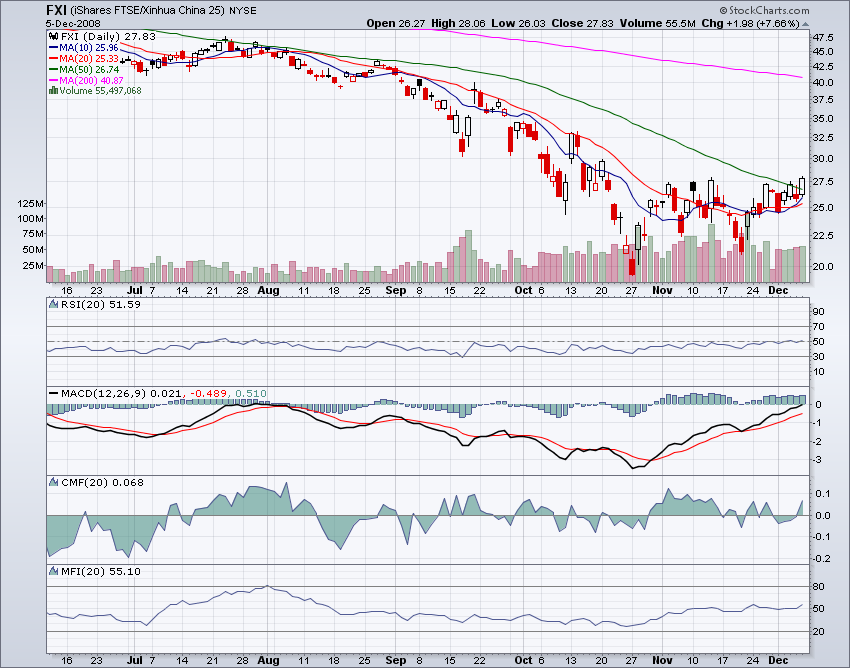
A more zoomed-in view of the six-month daily chart for FXI shows something is definitely happening with short-term moving averages turning up and making bullish cross-overs.
6-Month Daily FXI
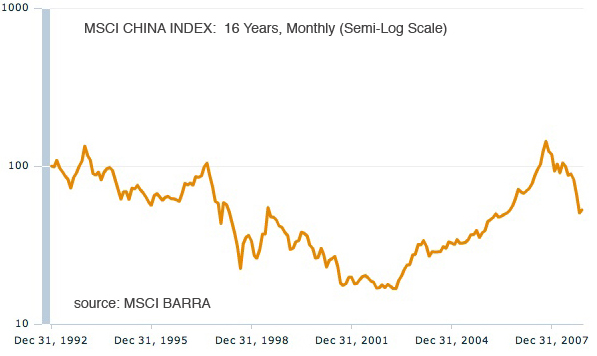
However, a 16-year monthly view of a larger China index is not as cheery. The China market is still a good way off from where it bottomed in 2001. Maybe that was in the “old days” before China became so prominent, but maybe that is a better indicator of where China stock prices may go.
16-Year Monthly MSCI China Index
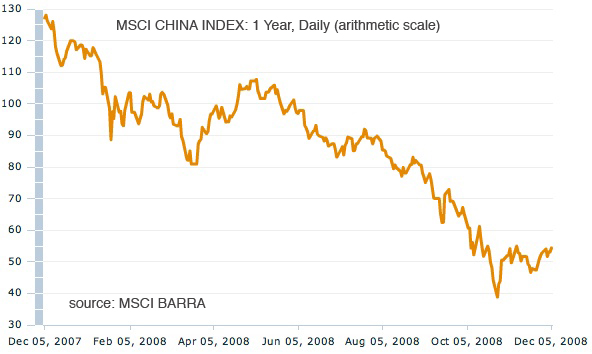
Zooming in to a 1-year daily chart of the MSCI China index, the recent tilt up is not quite as persuasive. The comparable upward moves in February and April were bear market rallies, as the current upward move may also be. This may be more of a tradeable rally than a sustainable reversal of trend. It is too early, in our view to make a fundamental argument for a trend reversal, but may not be too early to make a trading argument.
On the other hand, it is safer to bet against moves that are against the major trend, than to bet with moves that are against the major trend. If the major trend is still down, selling rallies is safer than buying them.
1-Year Daily MSCI China Index
From a fundamental perspective, the direction of the economy in China is still for reduced expectations, rising unemployment and company financial difficulties, reduced exports, and housing value declines. The government is implementing capital infusions to support the economy.
From a technical perspective, the conditions are changing in the shorter end. Market Edge Second Opinion is a technical service with this view:
- neutral, up from avoid since mid-November,
- mildly improving conditions,
- not a short candidate,
- not ready as a buy candidate,
- mixed bullish and bearish indicators.
One of their indicators is Moving Average Convergence Divergence (”MACD”) which is shown in the StocksCharts.com charts above. MACD is giving bullish signals and recent resistance has been pierced, but the intermediate trend is still down; and the long-term MSCI charts show there is still room below for more market price declines.
Here are some news clippings about the condition of the Baltic Dry Index, the condition of the Chinese steel industry, and the current and prospective market for basic materials, all of which have relevance to your decision about whether the primary down trend for China, and FXI in particular, is preparing to reverse or simply experience a counter-trend rally.
November 25, 2008 (Lloyds List)
The dry bulk shipping market has only seen the “tip of the iceberg” and many operators may not survive to the middle of next year, [according to Keith Denholm of Pacific Carriers].
…Denholm… painted a bleak picture of operators stuck with vessels time chartered at massively higher rates at present in the market, a huge glut of [ships] and ships being laid-up.
“I seriously think there is going to be a lot of blood out there. We're at the tip of the iceberg. I honestly can't see many operators surviving beyond July,” he warned the Lloyd's List Seatrans conference in Singapore.
… “I am not in anyway bullish on the next 12 months,” he stated.
Looking at the freight market and the Baltic Dry Index, while it is at an extremely low level, he believes it could fall further. … Although he also added that it simply could not go down too much further given how far it had already fallen. … “One thing is we never learn and we go from boom to bust,” he stated.
December 7, 2008 (China Daily)
China's steel industry has entered a hard time after seven years of rapid expansion, and a turnaround is unlikely until the second quarter next year, said Qi Xiangdong, deputy secretary with China Iron and Steel Association.
Slackening demand in both domestic and overseas markets have influenced the country's 71 major steel makers … Forty-two large or medium-sized steel companies posted loss in October. … Qi expected the steel export to slump next year due to dwindling global demand.
… Last month, China unveiled a stimulus package estimated at 4 trillion yuan amid efforts to offset adverse global economic conditions by boosting domestic demand.
All the money are planned to be spent over the next two years to finance programs in 10 major areas, such as low-income housing, rural infrastructure, water, electricity, transportation, the environment, technological innovation and rebuilding from several [natural] disasters
December 6, 2008 (Bloomberg)
Commodity prices plunged to their lowest in more than six years yesterday on concern the deepening global recession will cut demand. The Reuters/Jefferies CRB Index of 19 raw materials, including oil, copper and corn, is headed for the biggest annual drop since its debut in 1956 after plunging 56 percent from a July record.
“The problem for commodities at the moment is the complete lack of visibility on current quarter and 2009 actual demand and real consumption,” Macquarie analysts led by Jim Lennon said in a report e-mailed today. “The collapse in demand in the current quarter has been easily the largest anyone in all the industries we cover can recall, and we speak to some old people.”
Merrill Lynch slashed its forecasts for metals and bulk commodities, iron ore and coal. Copper may average $1.80 a pounce next year, down 20 percent from an earlier forecast, aluminum 88 cents a pound, down 20 percent, zinc 58 cents a pound, down 13 percent, and gold $897 an ounce, a 12 percent decline.
The medium- to longer-term outlook for the mining sector was positive as demand for commodities from China continued, Merrill said. “If investors can handle the volatility and are prepared to look more long term, then the next three-to-six months will offer great opportunity,” the report said.
By Richard Shaw
http://www.qvmgroup.com
Richard Shaw leads the QVM team as President of QVM Group. Richard has extensive investment industry experience including serving on the board of directors of two large investment management companies, including Aberdeen Asset Management (listed London Stock Exchange) and as a charter investor and director of Lending Tree ( download short professional profile ). He provides portfolio design and management services to individual and corporate clients. He also edits the QVM investment blog. His writings are generally republished by SeekingAlpha and Reuters and are linked to sites such as Kiplinger and Yahoo Finance and other sites. He is a 1970 graduate of Dartmouth College.
Copyright 2006-2008 by QVM Group LLC All rights reserved.
Disclaimer: The above is a matter of opinion and is not intended as investment advice. Information and analysis above are derived from sources and utilizing methods believed reliable, but we cannot accept responsibility for any trading losses you may incur as a result of this analysis. Do your own due diligence.
Richard Shaw Archive |
© 2005-2022 http://www.MarketOracle.co.uk - The Market Oracle is a FREE Daily Financial Markets Analysis & Forecasting online publication.