Inflationary Consequences of Fed Policy of Monetary Panic
Economics / Money Supply Dec 19, 2008 - 12:29 AM GMTBy: Ned_W_Schmidt

 Measurement is perhaps second greatest problem in establishing satisfactory economic policies for a nation. That matters because those economic policies influence the value of the nation's money on foreign exchange markets. In the case of the U.S. dollar, that $Gold has risen in value by more than 150% in the past ten years is unquestionably a failing grade for U.S. economic policy makers. Inflation measurement may be part of that inadequacy as it was used as a rationale for easy money.
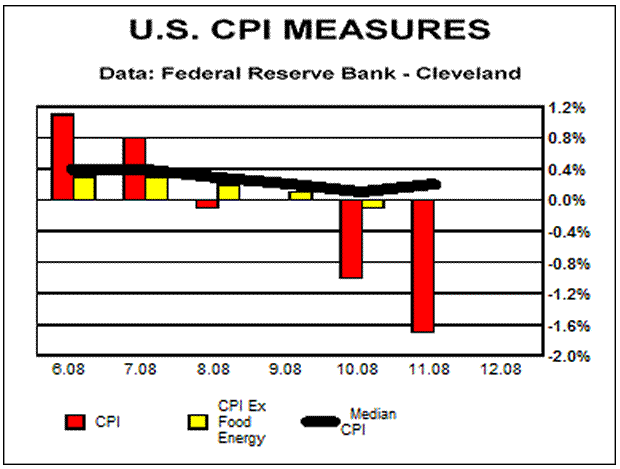
In this week's first chart are three measures of rate of change in U.S. consumer prices. The red bars are the monthly percentage change in the headline number for the U.S. consumer price index. Yellow bars are for the CPI excluding food and energy. The more interesting measure is the black line. That line is the Median CPI change as calculated each month by the diligent researchers at the Cleveland Federal Reserve Bank.

Median CPI is perhaps more useful of three measures. A median divides the sample into equal parts. In the case of the CPI, half of the components of the index had a higher percentage rate of change and half had a lower percentage rate of change. Median is often a better measure of central tendency when extreme values occur. For example, the move of the price of oil to $147 and then back to $40 puts a lot of volatility into headline number. Median is not as influenced by extreme values giving often a better picture of central tendency. As is apparent in the graph, the median CPI measure lacks the volatility of headline number and the understatement of inflation in CPI excluding food and fuel. For those interested, in latest month median U.S. CPI was up 0.2% and over past year it rose 3.1%.
While measurement is a problem as mentioned above, the primary impediment to successful economic policy in the U.S. continues to be inadequate leadership at the Federal Reserve. Little doubt exists that the most recent twenty years of leadership have been the worst in all of the 96 years of the Federal Reserve's existence. Regrettably, that problem is likely to be exacerbated by the Obama regime.
As the most populist administration elected since the Depression and with a clearly leaderless Congress, domestic spending is going to explode. No other way exists to buy the votes for the next Congressional election which is coming in less than two years. The Federal Reserve is committed to monetizing that spending, and the value of the dollar can only collapse under such a policy commitment. A $2 Euro in the next year is a near certainty as is $Gold back over a $1,000.
“Cookie Cutter” strategies are widespread at this time. Many expect an exact replay of the 1930s. Current U.S. monetary policy is as opposite of that of the 1930s as is possible. While the economic response to current monetary policy may be uncertain, it will not be a rerun of that which played in the 1930s. History is a guide, not a cookie cutter.

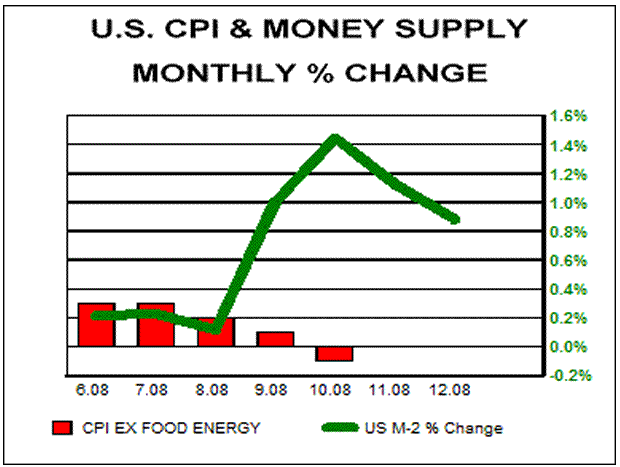
Federal Reserve's “Policy of Monetary Panic” is really only in its fourth month. Consequences of that policy have not yet had a chance to manifest themselves. The second graph may give us a hint of what is to come. Red bars are the monthly percentage change in the U.S. CPI excluding food and energy. The green line is the monthly change in U.S. money supply, M-2 NSA. In the early months the CPI results are consistent with the money supply growth. However, what is to come from the explosion in U.S. money supply growth? As of yet we know not the answer to that question. Based on history, we can conclude that economic stability, low inflation, a rising value for the dollar, and falling Gold prices are not part of the answer to that question.
By Ned W Schmidt CFA, CEBS
Copyright © 2008 Ned W. Schmidt - All Rights Reserved
GOLD THOUGHTS come from Ned W. Schmidt,CFA,CEBS, publisher of The Value View Gold Report , monthly, and Trading Thoughts , weekly. To receive copies of recent reports, go to http://home.att.net/~nwschmidt/Order_Gold_EMonthlyTT.html
Ned W Schmidt Archive |
© 2005-2022 http://www.MarketOracle.co.uk - The Market Oracle is a FREE Daily Financial Markets Analysis & Forecasting online publication.


