


Stock Markets Heading for Test of Lows in January 2009
Stock-Markets / Stocks Bear Market Dec 29, 2008 - 12:39 AM GMTBy: Andre_Gratian

 Current Position of the Market
SPX: Long-term trend -
Down! The very-long-term cycles have taken over and if they make their lows when expected, the bear market which started in October 2007 should continue until 2012-2014. This would imply that much lower prices lie ahead.
SPX: Intermediate trend - An intermediate low may have been reached in November, but this remains to be confirmed. There is good possibility that January 2009 will bring a new low, or at least a test of the lows.
Analysis of the short-term trend is done on a daily basis with the help of hourly charts. It is an important adjunct to the analysis of daily and weekly charts which determines the course of longer market trends.
Daily market analysis of the short term trend is reserved for subscribers. If you would like to sign up for a FREE 4-week trial period of daily comments, please let me know at ajg@cybertrails.com .
Overview:
The rally which started in November at 741 appears to have run out of steam. The SPX is now trading in a range from 851 to 918 and, with the news of the Fed rate cut and the auto rescue plan behind us, the index is drifting listlessly along the bottom of that range. Even the Santa Claus rally had little effect on it except, perhaps, to keep it from dropping down farther right away.
Most investors are long-term investors and they are the ones who have taken the brunt of the decline. It may be a while before they develop an appetite for putting more money in the market, especially when the Obama economic team is warning that the road to recovery will be rough and that we could see double-digit unemployment before we see some improvement. Although the stock market has already suffered a 50% decline from its high of October 2007, there is no guarantee that it cannot decline even more before it finds a bottom solid enough from which to start an intermediate-term rally. In his last newsletter, John Mauldin warns that there could still be significant fund redemption ahead, especially with the Bernard Madoff Scandal.
The twenty-three percent recovery from the November low has left the SPX overbought and the move sideways has barely begun to correct the indicators. It would take a much longer corrective period or a continuation of the decline to get them back in a position which could support another extensive rally. Cycles bottoming toward the end of January will undoubtedly contribute to the corrective process, as well as future news which should show that the economy is still in the process of deteriorating.
What's ahead?
Chart Pattern and Momentum
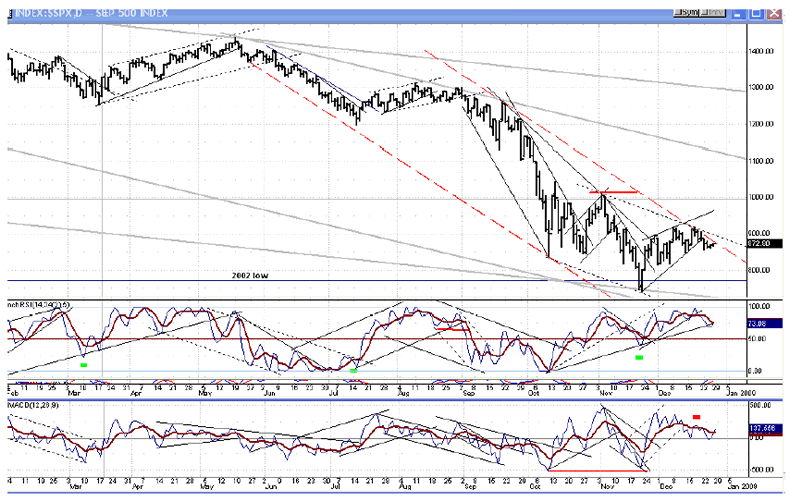
The price movement of the SPX is contained within several downward accelerating channels representing the various trends. The one which is shown in red dashes on the chart below probably defines the intermediate trend. Although the index showed important deceleration by refusing to go and touch the bottom channel line at the November low, it could not muster enough strength to go through the upper-channel line at the second top. It also met resistance at that level from the parallel to the (dotted) line drawn across its two previous lows.
The two indicators told us that the price would be likely to meet strong resistance from those two channel lines. By the time it had reached 918 for the second time, the top (momentum) oscillator was thoroughly overbought, and the lower (breadth) was showing negative divergence. We may now have to wait until the indicators are oversold and show positive divergence before we can try to penetrate those channel lines again and if we do not have too much weakness before then, the SPX should be able to break them and begin an intermediate-term rally.
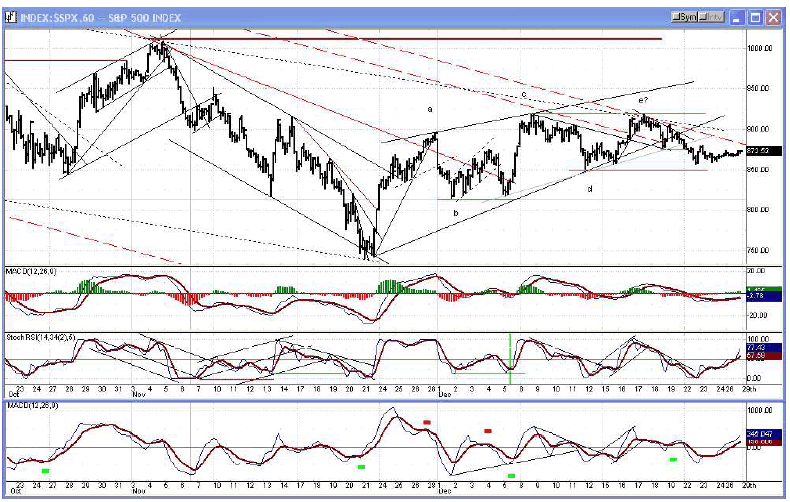
If we look at an hourly chart of the SPX (below), we can see more clearly the wedge which was created by the November/December rally. This is a 5-wave corrective move and once the fifth wave is in place, the index should continue in the direction of the primary trend. With the completion of the "e" wave, the rally should now be over and we should be resuming the down trend.
The first retracement from "e" brought the index close to the former low of 850. As long as it remains above that level, it could conceivably be preparing for an extension of the rally. But considering that the daily indicators are still overbought and that the hourlies are already well off their lows, it is more likely that another decline is starting which will either test the former low, or go beyond.
The hourly chart shows more clearly that the index was repelled precisely where the red dashes and black dots converge.
Cycles
The next 6-wk cycle is due at the end of the month, along with a minor cycle. If they are going to have an impact on prices, the sideways move of the last few days is just about over.
Projections:
With the wedge pattern apparently already complete, we can disregard the previous potential projection to 935-950.
If the SPX moves below 850, its first target and support will be 815. Should it continue to decline, 765 would be the next projection. If we stop around that price, it would make for a good test of the low and establish a good base for an intermediate reversal.
Should the decline continue, the worst case scenario is about 650.
Breadth
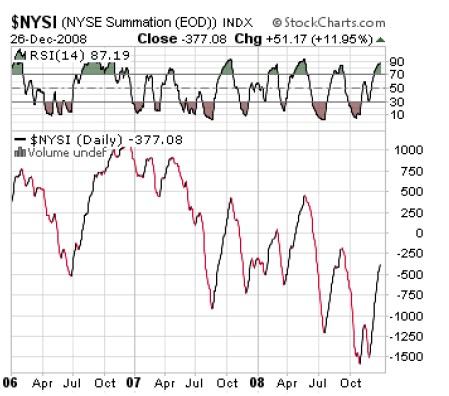
The hourly breadth indicator started another uptrend on 12/23. This kept the daily indicator positive which, in turn caused the Summation Index to continue its recovery journey. The chart below, (courtesy of StockCharts) shows that the latter is now approaching its former short-term top. Should it stay above the previous low on its next decline, it would have some implication for an intermediate trend reversal.
Market Leaders and Sentiment
There is still little divergence developing between the SPX and the NDX, which suggests that an important low is not yet in the making.
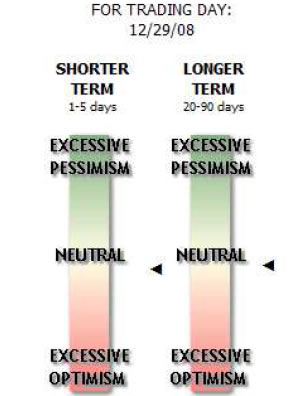
The sentiment indicators of the short and medium terms (courtesy Sentiment Trader) have hardly budged since two weeks ago and are still on the bearish side of neutral.
Summary
It looks as if the rally from 11/21 is over and the SPX is in a position to test its low and expand its base. If it can do this successfully over the next few weeks, it will create an intermediate low which will support a much better rally.
If it makes a new low, it could decline to 650 before finding support.
The following are examples of unsolicited subscriber comments:
What is most impressive about your service is that you provide constant communication with your subscribers. I would highly recommend your service to traders. D.A.
Andre, you did it again! Like reading the book before watching the movie. B.F.
I would like to thank you so much for all your updates/newsletters. As I am mostly a short-term trader, your work has been so helpful to me as I know exactly when to get in and out of positions. I am so glad I decided to subscribe to Turning Points… Please rest assured that I shall continue to be with Turning Points for a long time to come. Thanks once again! D.P.
But don't take their word for it! Find out for yourself with a FREE 4-week trial. Send an email to ajg@cybertrails.com .
By Andre Gratian
MarketTurningPoints.com
A market advisory service should be evaluated on the basis of its forecasting accuracy and cost. At $25.00 per month, this service is probably the best all-around value. Two areas of analysis that are unmatched anywhere else -- cycles (from 2.5-wk to 18-years and longer) and accurate, coordinated Point & Figure and Fibonacci projections -- are combined with other methodologies to bring you weekly reports and frequent daily updates.
“By the Law of Periodical Repetition, everything which has happened once must happen again, and again, and again -- and not capriciously, but at regular periods, and each thing in its own period, not another’s, and each obeying its own law … The same Nature which delights in periodical repetition in the sky is the Nature which orders the affairs of the earth. Let us not underrate the value of that hint.” -- Mark Twain
You may also want to visit the Market Turning Points website to familiarize yourself with my philosophy and strategy.www.marketurningpoints.com
Disclaimer - The above comments about the financial markets are based purely on what I consider to be sound technical analysis principles uncompromised by fundamental considerations. They represent my own opinion and are not meant to be construed as trading or investment advice, but are offered as an analytical point of view which might be of interest to those who follow stock market cycles and technical analysis.
Andre Gratian Archive |
© 2005-2022 http://www.MarketOracle.co.uk - The Market Oracle is a FREE Daily Financial Markets Analysis & Forecasting online publication.