


Stock Market Index Investing Using Moving Averages
InvestorEducation / Learning to Invest Jan 03, 2009 - 08:58 AM GMTBy: Donald_W_Dony

 The art of index investing. How to optimize index funds with simple moving averages.
Warren Buffet got it right. Arguably, the world's best know investor has for years been advocating to both private and professional investors that the simple index funds offer superior returns to actively managed portfolios.
The art of index investing. How to optimize index funds with simple moving averages.
Warren Buffet got it right. Arguably, the world's best know investor has for years been advocating to both private and professional investors that the simple index funds offer superior returns to actively managed portfolios.
In a past interview, Mr. Buffet stated that "most investors, both institutional and individual, will find that the best way to own common stocks is through an index fund. Those following this path are sure to beat the net results delivered by the great majority of investment professionals." The net returns of most actively managed mutual funds over the past few years certainly supports Warren's approach. In a June 2008 article from the Global and Mail, analysis had found that only 4.13% of active Canadian equity fund managers were able to outperform the S&P/TSX Composite during the bull market run of 2003-2008. U.S. equity fund managers scored similar results in performance over the last five years.
Where active money management does appear to be adding some value to investors is during bear markets. Both Canadian and U.S. managers, according to Standard and Poor research, suggests that many mutual funds did not plunge as severely as did the general market. However, as bear markets normally last 1 year verses the 3-4 years of bull rises, the argument appears weak to rationalize that active fund management is superior to passive index funds simply for the potential protective performance during short bear markets while sacrificing the longer-term returns from the bull markets.
Yet, is the standard off-the-shelf investing approach of buy-and-hold the best method for the long-term investor or are there simple 'add-ons' that can deliver better downside protection while locking in most of the upside movement of the bull market? Technical models would indicate that the answer is yes.
In the 14-year chart of the S&P 500, this bell-whether index has remained in a broad trading range for the last 10 years. Upper resistance has been at 1575 and lower support at 800. The long-term investor would would have been in a holding pattern for nearly a decade. However, with the addition of a simple technical tool, the moving average, the investor now has a time-tested mechanical system that provides reliable buy and sell signals.
The key to using the moving average effectively is optimizing its time period to provide the earliest but safest buy and sell signals. This is achieved by adjusting the time period of the moving average to hold close to the lows of the index during a bull market (1993-2000 and 2003-2007) and staying close to the index peaks in a bear market (2000-2003 and 2008-present). I have found, after some experimentation, that a 65 week simple moving average is a very effective time frame (see Chart 1) and offers both excellent buy and sell signals.
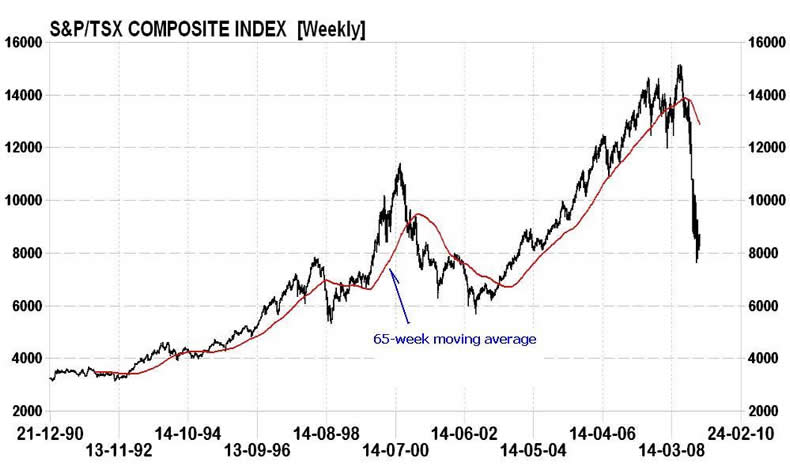
The 65-week m/a also provides accurate and early buy and sell signals for the Canada's S&P/TSX Composite. In the long-term chart of the TSX (Chart 2), the 65-week m/a would have held the investor in the 1992-1997, 1999-2000 and the most recent 2003-2008 bull markets while offering an early sell signal in the 2000-2003 bear market and another key signal in the current downtrend (January 2008).
Bottom line: Though it is widely recorded that index funds can offer higher long-term performance than most actively managed mutual funds, additional returns in bull markets and safety in bear markets are easily achievable by adding a simple moving average. Long-term models have repeatedly shown the advantage in both advancing and declining markets over the traditional buy-and-hold strategy.
Investment approach: As both the S&P 500 and the S&P/TSX Composite are currently below their 65-week m/a, long-term investors may wish to remain out of the market until both indexes eventually trade up through their m/a. This is expected to occur in late 2009 or early 2010.
On-going chart analysis of both the S&P 500 and the S&P/TSX 60 with their 65-week moving averages are available in the monthly newsletter. Go to www.technicalspeculator.com and click on member login.
Your comments are always welcomed.
By Donald W. Dony, FCSI, MFTA
www.technicalspeculator.com
COPYRIGHT © 2008 Donald W. Dony
Donald W. Dony, FCSI, MFTA has been in the investment profession for over 20 years, first as a stock broker in the mid 1980's and then as the principal of D. W. Dony and Associates Inc., a financial consulting firm to present. He is the editor and publisher of the Technical Speculator, a monthly international investment newsletter, which specializes in major world equity markets, currencies, bonds and interest rates as well as the precious metals markets.
Donald is also an instructor for the Canadian Securities Institute (CSI). He is often called upon to design technical analysis training programs and to provide teaching to industry professionals on technical analysis at many of Canada's leading brokerage firms. He is a respected specialist in the area of intermarket and cycle analysis and a frequent speaker at investment conferences.
Mr. Dony is a member of the Canadian Society of Technical Analysts (CSTA) and the International Federation of Technical Analysts (IFTA).
Donald W. Dony Archive |
© 2005-2022 http://www.MarketOracle.co.uk - The Market Oracle is a FREE Daily Financial Markets Analysis & Forecasting online publication.