Stock Market Selloff Relieves Overbought Pressure
Stock-Markets / US Stock Markets Jan 11, 2009 - 08:46 AM GMTBy: Mike_Burk
 The good news is: Although all of the major indices were down substantially last week, new lows hit their lowest levels since November 2006.
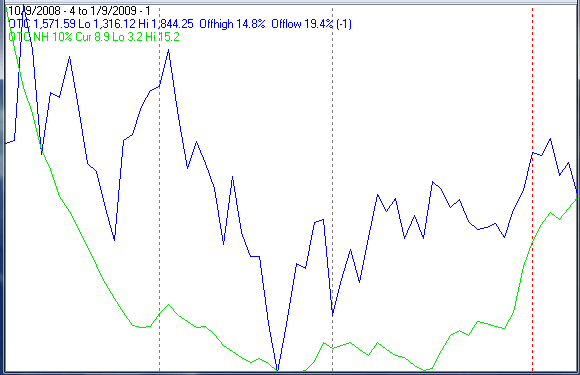
Short Term New highs expand in strong markets. Recently we have seen the lowest levels of new highs since late 1987 when there were about half as many issues traded on the NYSE and 20% fewer on the NASDAQ than there are currently.
The chart below covers the past 3 months showing the NASDAQ composite (OTC) in blue and a 10% trend (19 day EMA) of NASDQ new highs (OTC NH) in green. The indicator hit a 2 month high on Friday in spite of a sharp decline in prices.
The picture is less encouraging using NYSE data.
The chart below covers the past year showing the S&P 500 (SPX) in red and NY NH calculated from NYSE new highs in green.
NY NH hit its lowest level since late 1987 on Friday.
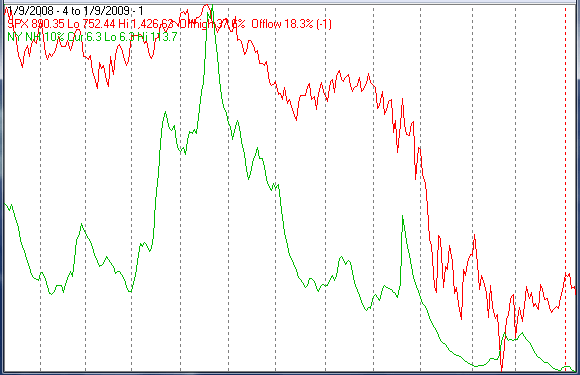
The secondaries lead both up and down and the NASDAQ is populated with a higher percentage of smaller capitalization issues than the NYSE so some encouragement can be taken from the relative strength in OTC NH.
Intermediate term
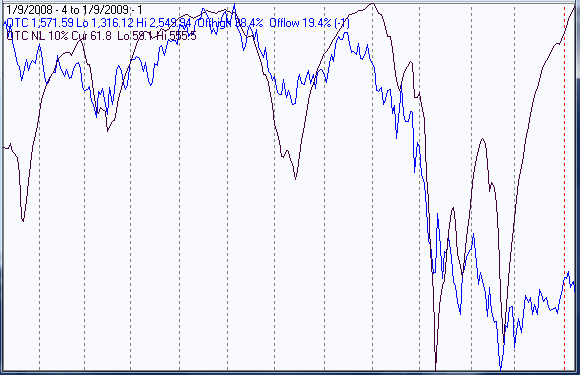
New lows fell to single digits last week for the first time since November 2006.
The chart below covers the past year showing the OTC in blue and a 10% trend of NASDAQ new lows (OTC NL) in black. OTC NL has been plotted on an inverted Y axis so decreasing new lows move the indicator upward (up is good). The indicator is moving sharply upward and just shy of its high point for the year.
The chart below offers another way of looking at the new high - new low data. The chart covers the past year and a half showing the OTC in blue and 40% trend (4 day EMA) of NASDAQ new highs divided by new highs + new lows (OTC HL Ratio) in red. Over the past year and a half the indicator spent the longest time under the 50% level since 1978 when the data began being calculated by the current methodology. Current it is slightly above the 50% level.
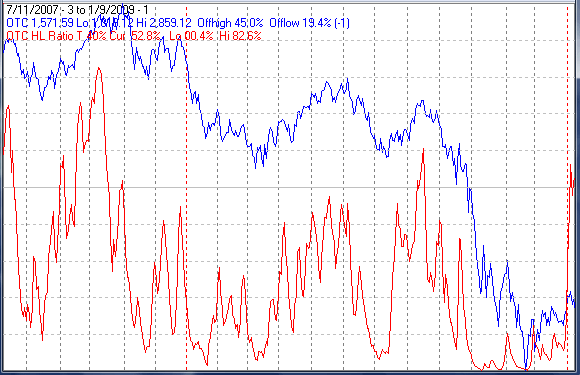
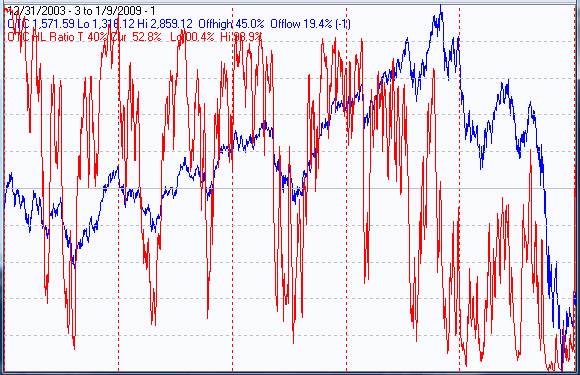
The chart below is similar to the one above except it covers the past 5 years so you can get a longer term perspective on that indicator.
Seasonality
Next week includes the 5 trading days prior to the 3rd Friday in January during the 1st year of the Presidential Cycle. It also includes the 5 trading days prior to the Martin Luther King (MLK) holiday. The MLK holiday was first observed in 1986, however the markets did not close for it until 1998.
There are two sets of tables, the first show the daily return on a percentage basis for the 5 trading days prior to the 3rd Friday in January during the 1st year of the Presidential Cycle while the second shows the daily return during the 5 trading days prior to MLK day. OTC data covers the period from 1963 - 2007 and SPX data from 1953 - 2007. There are summaries for both the 1st year of the Presidential Cycle and all years combined. Prior to 1953 the market traded 6 days a week so that data has been ignored.
By all measures the period has been positive. The average returns have been distorted by extremes in 2001.
Report for the week before the 3rd Friday of January
The number following the year is the position in the presidential cycle.
Daily returns from Monday through 3rd Friday.
| OTC Presidential Year 1 | ||||||
| Year | Mon | Tue | Wed | Thur | Fri | Totals |
| 1965-1 | 0.26% | 0.20% | 0.09% | 0.09% | 0.07% | 0.70% |
| 1969-1 | -0.76% | -0.74% | -0.16% | 0.65% | 1.11% | 0.10% |
| 1973-1 | -0.61% | -1.04% | -0.42% | 0.03% | -0.15% | -2.19% |
| 1977-1 | -0.06% | -0.01% | 0.43% | -0.48% | 0.25% | 0.13% |
| 1981-1 | 0.39% | -0.20% | 0.52% | 0.39% | 0.64% | 1.75% |
| 1985-1 | 1.28% | 0.93% | 0.95% | 0.35% | 0.72% | 4.25% |
| Avg | 0.05% | -0.21% | 0.26% | 0.19% | 0.52% | 0.81% |
| 1989-1 | 0.07% | -0.34% | 0.73% | 0.57% | 0.15% | 1.18% |
| 1993-1 | 0.14% | -0.19% | 0.09% | 0.48% | 0.12% | 0.64% |
| 1997-1 | -0.08% | 1.11% | -0.89% | 0.51% | 0.64% | 1.29% |
| 2001-1 | 0.00% | -0.30% | 2.45% | 3.19% | 0.07% | 5.41% |
| 2005-1 | 0.00% | 0.87% | -1.54% | -1.34% | -0.57% | -2.58% |
| Avg | 0.04% | 0.23% | 0.17% | 0.68% | 0.08% | 1.19% |
| OTC summary for Presidential Year 1 1965 - 2005 | ||||||
| Avg | 0.07% | 0.03% | 0.20% | 0.40% | 0.28% | 0.97% |
| Win% | 56% | 36% | 64% | 82% | 82% | 82% |
| OTC summary for all years 1963 - 2008 | ||||||
| Avg | 0.09% | 0.20% | 0.13% | 0.26% | 0.03% | 0.70% |
| Win% | 64% | 59% | 61% | 67% | 61% | 72% |
| SPX Presidential Year 1 | ||||||
| Year | Mon | Tue | Wed | Thur | Fri | Totals |
| 1953-1 | -0.84% | 0.62% | 0.23% | 0.19% | -0.42% | -0.22% |
| 1957-1 | -0.69% | -1.48% | 0.11% | -0.02% | -1.28% | -3.37% |
| 1961-1 | -0.03% | -0.40% | 0.57% | 0.15% | 0.32% | 0.61% |
| 1965-1 | 0.32% | 0.16% | -0.03% | -0.09% | 0.25% | 0.61% |
| 1969-1 | -0.53% | 0.73% | 0.48% | 0.55% | -0.15% | 1.09% |
| 1973-1 | -0.72% | -0.25% | 0.46% | 0.14% | -0.06% | -0.43% |
| 1977-1 | -0.27% | -0.40% | 0.51% | -0.85% | 0.34% | -0.66% |
| 1981-1 | 0.03% | -0.17% | 0.14% | 0.64% | 0.34% | 0.96% |
| 1985-1 | 1.55% | 0.18% | 0.22% | -0.27% | 0.35% | 2.02% |
| Avg | 0.01% | 0.02% | 0.36% | 0.04% | 0.16% | 0.60% |
| 1989-1 | 0.10% | -0.21% | 1.05% | 0.13% | -0.09% | 0.97% |
| 1993-1 | -0.07% | -0.39% | -0.40% | 0.49% | 0.14% | -0.24% |
| 1997-1 | 0.00% | 1.23% | -0.22% | 0.33% | 0.83% | 2.18% |
| 2001-1 | 0.00% | 0.63% | 0.21% | 1.39% | -0.40% | 1.83% |
| 2005-1 | 0.00% | 0.97% | -0.95% | -0.78% | -0.64% | -1.40% |
| Avg | 0.01% | 0.45% | -0.06% | 0.31% | -0.03% | 0.67% |
| SPX summary for Presidential Year 1 1953 - 2005 | ||||||
| Avg | -0.10% | 0.09% | 0.17% | 0.14% | -0.03% | 0.28% |
| Win% | 42% | 50% | 71% | 64% | 50% | 57% |
| SPX summary for all years 1953 - 2008 | ||||||
| Avg | -0.01% | 0.08% | 0.02% | 0.08% | -0.10% | 0.07% |
| Win% | 47% | 57% | 55% | 60% | 52% | 52% |
| OTC week prior to MLK day in Presidential Year 1 | ||||||
| Day5 | Day4 | Day3 | Day2 | Day1 | Totals | |
| 1989-1 | 0.14% | 1 -0.18% | 2 0.19% | 3 0.44% | 4 0.02% | 5 0.61% |
| 1993-1 | 0.77% | 1 -0.43% | 2 1.08% | 3 1.30% | 4 0.21% | 5 2.92% |
| 1997-1 | -0.08% | 1 1.11% | 2 -0.89% | 3 0.51% | 4 0.64% | 5 1.29% |
| 2001-1 | -0.49% | 1 1.89% | 2 3.40% | 3 4.61% | 4 -0.53% | 5 8.88% |
| 2005-1 | 0.40% | 1 -0.83% | 2 0.62% | 3 -1.05% | 4 0.84% | 5 -0.02% |
| Avg | 0.15% | 0.31% | 0.88% | 1.16% | 0.23% | 2.74% |
| OTC summary for week prior to MLK day in Presidential Year 1 | ||||||
| Averages | 0.15% | 0.31% | 0.88% | 1.16% | 0.23% | 2.74% |
| %Winners | 60% | 40% | 80% | 80% | 80% | 80% |
| MDD 1/13/2005 1.26% -- 1/15/1997 .89% -- 1/12/2001 .53% | ||||||
| OTC summary for week prior to MLK day in all years | ||||||
| Averages | 0.39% | -0.25% | 0.11% | 0.53% | 0.19% | 0.97% |
| %Winners | 70% | 52% | 61% | 57% | 65% | 74% |
| SPX week prior to MLK day in Presidential Year 1 | ||||||
| Day5 | Day4 | Day3 | Day2 | Day1 | Totals | |
| 1989-1 | 0.11% | 1 -0.21% | 2 0.58% | 3 0.41% | 4 0.25% | 5 1.14% |
| 1993-1 | 0.44% | 1 0.02% | 2 0.46% | 3 0.67% | 4 0.28% | 5 1.87% |
| 1997-1 | 0.00% | 1 1.23% | 2 -0.22% | 3 0.33% | 4 0.83% | 5 2.18% |
| 2001-1 | -0.19% | 1 0.38% | 2 0.96% | 3 1.03% | 4 -0.64% | 5 1.54% |
| 2005-1 | 0.34% | 1 -0.61% | 2 0.40% | 3 -0.86% | 4 0.60% | 5 -0.13% |
| Avg | 0.14% | 0.16% | 0.44% | 0.32% | 0.26% | 1.32% |
| SPX summary for week prior to MLK day in Presidential Year 1 | ||||||
| Averages | 0.14% | 0.16% | 0.44% | 0.32% | 0.26% | 1.32% |
| %Winners | 80% | 60% | 80% | 80% | 80% | 80% |
| MDD 1/13/2005 1.08% -- 1/12/2001 .64% -- 1/15/1997 .22% | ||||||
| SPX summary for week prior to MLK day in all years | ||||||
| Averages | 0.31% | -0.21% | 0.00% | 0.15% | 0.31% | 0.57% |
| %Winners | 74% | 39% | 61% | 61% | 70% | 70% |
Money Supply
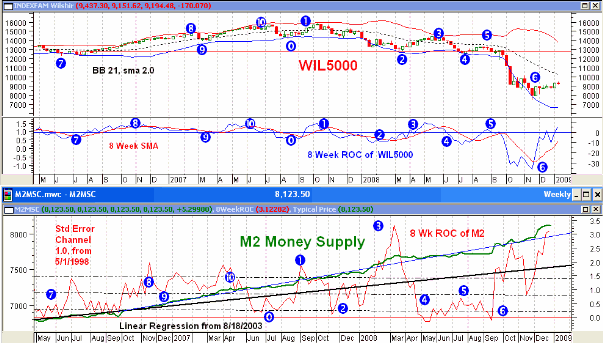
The chart below as provided by Gordon Harms. For the past few weeks money supply has been growing at a sharply accelerated rate.
Conclusion
Last weeks sell off relieved the overbought condition while NASDAQ new highs increased and new lows on both exchanges fell to the lowest levels in years. Seasonally next week has a strong upward bias.
I expect the major indices to be higher on Friday January 16 than they were on Friday January 9.
Thank you,
By Mike Burk
To subscribe to this report : http://alphaim.net/signup.html
Gordon Harms produces a Power Point for our local timing group. You can get a copy of that at: http://www.stockmarket-ta.com/ .
Disclaimer: Mike Burk is an employee and principal of Alpha Investment Management (Alpha) a registered investment advisor. Charts and figures presented herein are believed to be reliable but we cannot attest to their accuracy. Recent (last 10-15 yrs.) data has been supplied by CSI (csidata.com), FastTrack (fasttrack.net), Quotes Plus (qp2.com) and the Wall Street Journal (wsj.com). Historical data is from Barron's and ISI price books. The views expressed are provided for information purposes only and should not be construed in any way as investment advice. Furthermore, the opinions expressed may change without notice.
Mike Burk Archive |
© 2005-2022 http://www.MarketOracle.co.uk - The Market Oracle is a FREE Daily Financial Markets Analysis & Forecasting online publication.


