


Which Shines More: Gold, Silver or Crude Oil?
Commodities / Gold & Silver 2009 Jan 12, 2009 - 09:53 AM GMTBy: Chris_Vermeulen

 Last week gold and silver remained in a trading range moving sideways, while crude oil had a large pullback on very heavy volume. Below are charts which will show where these commodities stand in relation to support and resistance as well as where we may be looking to go long in the near future.
Hello, I'm Chris Vermeulen founder of TheGoldAndOilGuy and NOW is YOUR Opportunity to start trading GOLD, SILVER & OIL for BIG PROFITS. Let me help you get started.
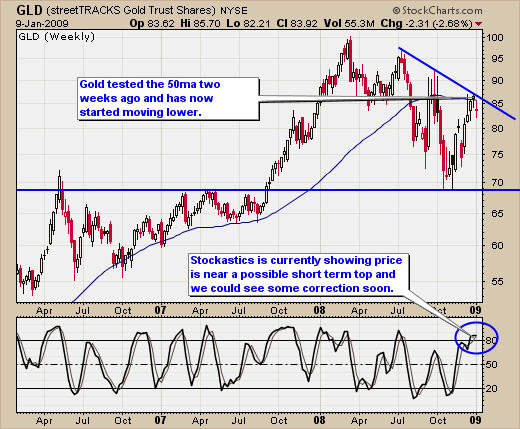
Intermediate Trend of Gold – Weekly Outlook
Gold found support back in October and has since had a nice rally higher. The weekly chart shows this rally/bounce very clearly. Currently gold is trading at a resistance level, which is the downward trend line. Gold hit its head and has now started to move lower. The Stochastic indicator at the bottom of the chart is also indicating we are at a short term top. This is not a good time for longs to be entering or adding new positions of this metal. Waiting for a pullback and reversal would provide a much lower risk trade as well as more profit potential.
Intermediate Trend of Gold - Weekly Gold Trading Chart
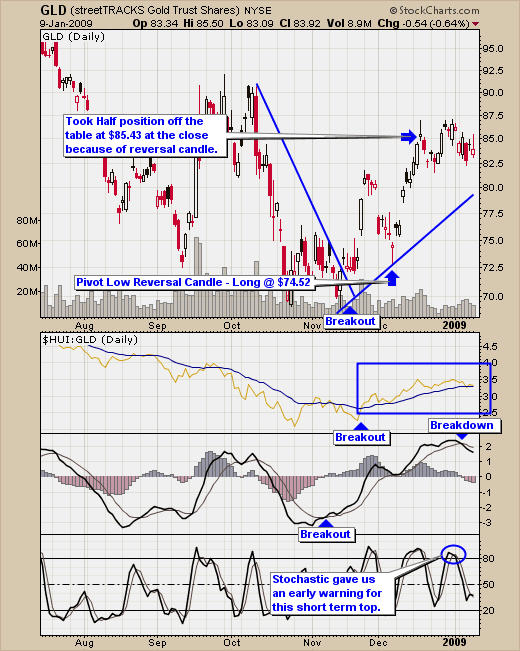
Swing Trading Gold Trends – Daily Outlook
Swing trading gold provides excellent opportunities for making consistent gains trade after trade. The daily chart provides lots of high probability trades each year as we buy and sell during cycle's bottoms and tops. This daily chart of gold shows how it swings along with our current entry and exit points. By combining several indicators (Trend Lines, Equities, Bullion Ratio, MACD, and my Stochastic) and my simple to follow trading model, buy and sell signals are very clear to a trained eye.
Gold is currently moving sideways above our support trend line and I am expecting prices to dip lower and possibly generate another buy signal soon. We currently own 50% of our gold position as we booked a nice 15% profit on the first half and waiting to add to our position within the next week or two. There are several criteria, which must be met as we only want to enter gold trades when risk is under 3%.
Swing Trading Gold Trends – Daily Gold Trading Chart
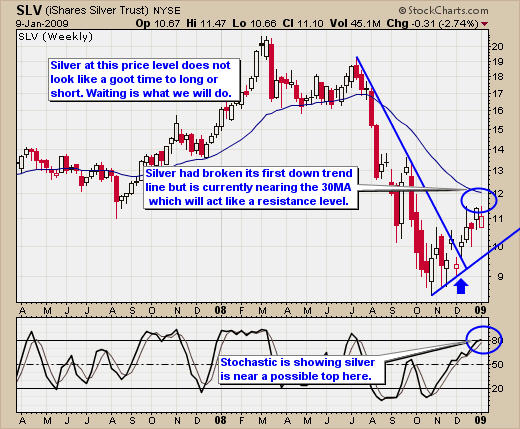
Intermediate Trend of Silver – Weekly Outlook
Silver has been holding up very nicely over the past couple weeks and still looks like it may have a little more room to climb on the weekly chart to around the $12 level. What I am looking for is a pullback towards the support trend line and then we will use the daily silver trading chart to time our entry. Silver is currently floating in between support and resistance right now.
Intermediate Trend of Silver – Weekly Silver Trading Chart
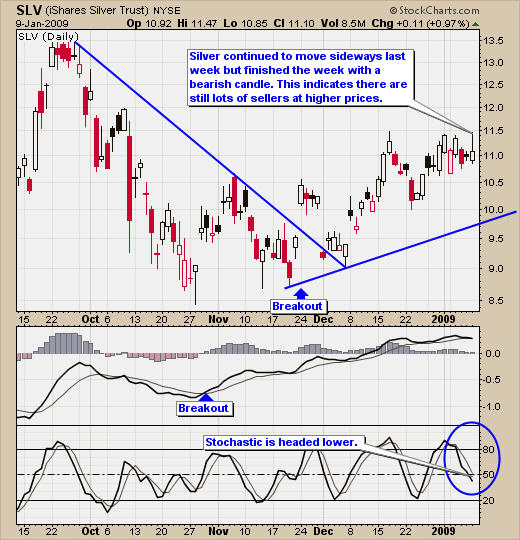
Swing Trading Silver – Daily Outlook
Silver has been forming a nice looking wedge, which generally indicates prices should continue higher over the intermediate term. We would like to see silver continue sideways or pullback toward our support trend line before we putting money to work.
Swing Trading Silver – Daily Silver Trading Chart
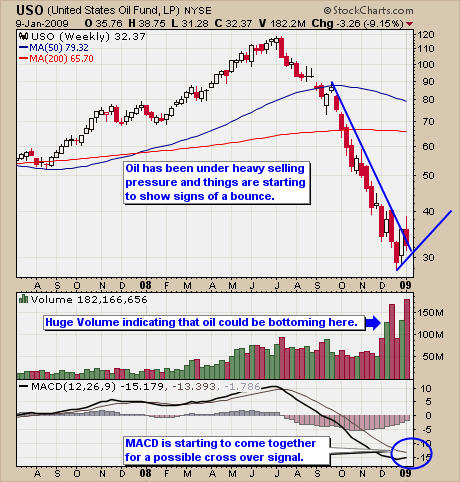
Intermediate Trend of Crude Oil – Weekly Outlook
Crude oil over the past couple of weeks has become more volatile indicating a shift in momentum could be just around the corner, “Pardon the pun”. We almost had a trend line break last week but prices sold into the close on Friday. Crude oil volume has shot through the roof over the past 6 weeks, which is important to note, as this looks like capitulation volume and buyers are trying to push sellers higher. The MACD is starting to look like it may cross soon, which indicates momentum is shifting towards the upside as well.
Intermediate Trend of Crude Oil – Weekly Crude Oil Trading Chart
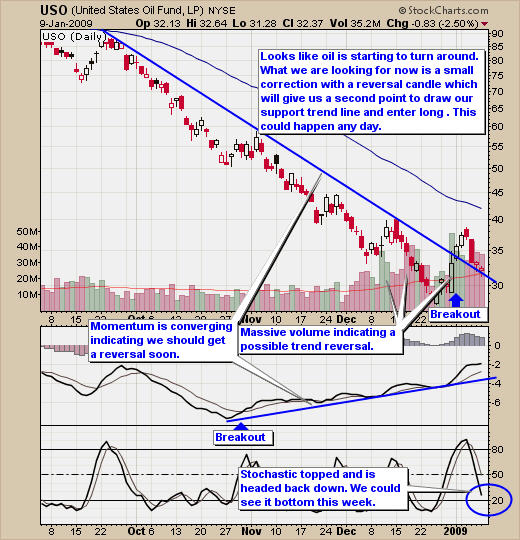
Swing Trading Crude Oil – Daily Outlook
Swing trading oil provides huge opportunities and after such a long hard selloff it stands to have a big bounce or rally. Oil has broken it's down trend line and has since pulled back to the trend line, as it will now provide support. If prices can reverse in a controlled manor then we just may get a low risk entry point any day now. The MACD is showing bullish momentum and in a couple days the Stochastic should be near the bottom of its range. Waiting for a reversal candle is important before we put our money to work because technically oil is still is a very strong down trend.
Swing Trading Crude Oil – Daily Oil Trading Chart
Swing Trading Gold, Silver and Oil Conclusion:
Gold is currently trading at resistance and showing signs of short term weakness. We continue to hold our core position until we have a break of our support trend line. But if we get a reversal candle we will be looking to add to our position for another leg higher.
Silver looks to be holding up nicely but it's currently floating between support and resistance. Risk is much too high at this level and therefore we will wait.
Crude Oil looks like it could really pop, as it has been under heavy sell pressure for a long time. Not only that but because oil is in the new, and individuals around the world are now following it, it stands a chance for a really big bounce/ rally soon. The daily oil trading chart is telling us we could have a buy signal any day now if risk is under 3%.
I have put together a package for yearly subscribers which is if you join for a year ($299) I will send you $300 in gas vouchers FREE which are valid at the major gas stations in USA & Canada. Valid At: Chevron, Texaco, Sunoco, CITGO, Mobil, Esso, Shell, BP, And More... as Holiday Special!
If you interested please act fast as I only have a few of these gas vouchers before they are gone for good.
If you have any questions please feel free to send me an email. My passion is to help others and for us all to make money together with little down side risk.
I look forward to hearing from you soon!
For more information, questions or to receive my Free Weekly Special Report please visit my website: www.TheGoldAndOilGuy.com
By Chris Vermeulen
Chris@TheGoldAndOilGuy.com
Please visit my website for more information. http://www.TheGoldAndOilGuy.com
Chris Vermeulen is Founder of the popular trading site TheGoldAndOilGuy.com. There he shares his highly successful, low-risk trading method. For 6 years Chris has been a leader in teaching others to skillfully trade in gold, oil, and silver in both bull and bear markets. Subscribers to his service depend on Chris' uniquely consistent investment opportunities that carry exceptionally low risk and high return.
This article is intended solely for information purposes. The opinions are those of the author only. Please conduct further research and consult your financial advisor before making any investment/trading decision. No responsibility can be accepted for losses that may result as a consequence of trading on the basis of this analysis.
Chris Vermeulen Archive |
© 2005-2022 http://www.MarketOracle.co.uk - The Market Oracle is a FREE Daily Financial Markets Analysis & Forecasting online publication.