


Navigating the HUI (Gold Bugs Index) Using Elliott Wave Theory
InvestorEducation / Elliott Wave Theory Apr 23, 2007 - 11:13 AM GMTBy: Joseph_Russo

Providing a consistently accurate road map for traders and investors is both a rewarding and challenging responsibility that we passionately embrace. We approach our calling as though legally bound by the highest of fiduciary standards.
Although it is clearly impossible for one to know with any level of certainty how and when prices will move within a given series, this article will provide testament that it is indeed plausible to attain a distinct advantage, and actionable level of foreknowledge relative to dynamic price evolution in both time and amplitude.
Success in the two separate endeavors of trading and analysis is by no means failsafe or a sure thing. To the contrary, trading losses, and failed forecasting signals generously populate the real life experience of the most successful traders and analysts. In this business, no individual, method, or system can get things right all of the time. Within the chart archives below, we will provide such examples of real-world challenges and triumphs.
The HUI's Long-Term Wave Structure:
|
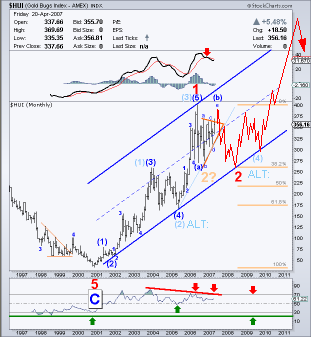 Our monthly analysis plots the price action from the low in 2000 at 35.31, labeled as terminal to Primary 5 of a larger degree bear market [C] wave terminal. One must recognize that Elliott Wave Theory along with the balance of technical analysis is mostly subjective, and open to variant perceptions. For example, one can interpret the five wave advance to our preferred (3) terminal as a completed first wave. Doing so places the May '06 high as ALT: (3) Both views are valid. Although continuously subject to changing dynamics, for the moment, our preferred and first alternate views interpret the larger degree HUI wave structures as labeled. Bare in mind, no single form of analysis should take precedence over the price action itself.
The HUI's meteoric rise
From its Cycle Degree print low of 35.31 in November of 2000- measured to its print high in May 2006 at 401.69, the HUI has skyrocketed more than 1037% in 5½ years! In contrast, the Gold price itself has only appreciated 192% in the same peak to trough period. In our view, the HUI's meteoric rise has topped, or remains in progress of terminating a first leg up of Primary dimension. Consolidations to date have yet to correct the 1037% Primary Degree advance in corresponding proportion. We suspect a proportionate correction may either take place later this year, or out as far as 2009 in confluence with a potential eight-year cycle low due in Gold.
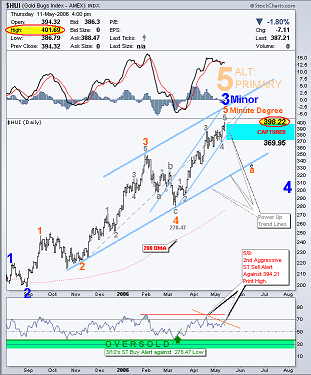
Navigating the HUI Below is an archived account of Elliott Wave Technology's real time analysis of the HUI. The archived works will show how we have dynamically adjusted to the evolving price action in arriving at our most current interpretation as represented in the monthly chart above. As the guidance will illustrate, “ it matters not that our current “wave count” is correct, or set in stone, but rather that we interpret the price action in such a way so that our clients can profit as the count works itself out however it so chooses .” From Elliott Wave technology's near Term outlook may 11, 2006 We open the archives as the HUI prints its terminal high of 401.60. Note the deep oversold condition highlighted at the 4 -wave low of 278 the previous March 10. Looking back to March of 2006, our guidance suggested clients adopt a bullish bias toward the HUI. By early April, we positioned an upside capture window above the market between 369 and 398. From our March 2006 guidance, the HUI had advanced some 41% in two months time. By May 11, price had surpassed our upside capture window. By that time, we had already issued our second sell probe-advising clients to adopt a bearish posture against the fresh highs. |
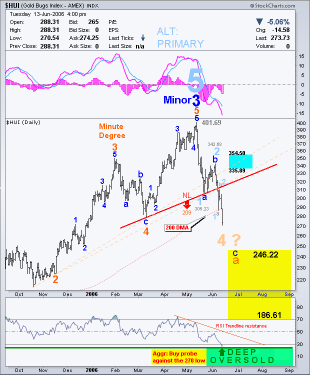
The next chart from our archive shows the devastating decline that took place in just over a month. From the 401.60 high in May, the HUI had plummeted 131 points, losing more than 30% of its value. Chart highlights include the capture of a smaller interim counter trend b wave rally into early June. That rally terminated between 335-354 prior to the HUI succumbing to its next leg down. Although our downside targets failed to elect, the severity of decline, level of oversold readings, and the prospect of a 4 th wave down basing, prompted us to begin guiding clients to reversing trading bias from bearish to bullish by mid-June. |
 From Elliott Wave technology's
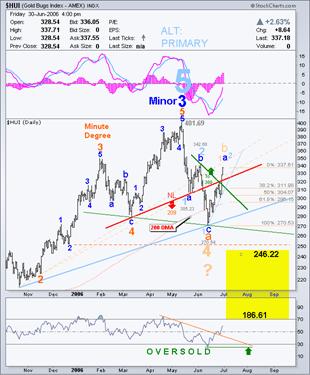
By the end of June, our previous mid-month guidance reversing bias to the bullish side was paying off brilliantly. The HUI was now trading 24% above its lows from just two weeks prior. This chart highlights the evolution of our dynamic wave interpretation as it unfolds against the price action. At that time, our preferred view was that the HUI was in process of topping a smaller degree a wave en-route toward a larger b wave terminal. Our first alternate view suggested that the b wave was already in process of topping. |
 From Elliott Wave technology's
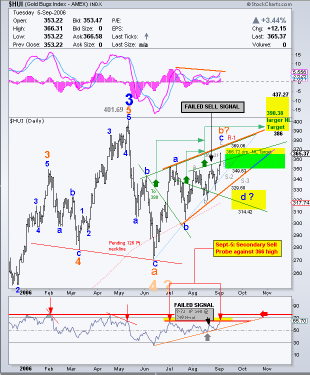
Our next archived chart fast-forwards two months from the previous. Much had transpired in these two months. We successfully guided traders to fade the – a- wave high and protect profits appropriately upon the basing of – b- in July. After that, the environment became extremely challenging, and we made some bad calls. On August 23 rd (see black arrows) we incorrectly, and prematurely assumed that the larger b wave had terminated upon the 354.16 high. Our premature August 23 rd guidance toward a bearish stance provided immediate, but very short lived results. After falling nearly 20 pts in four days, price action whipsawed, and the August guidance was in drawdown of nearly 4% by the time this b wave finally topped some 15 points above our bearish call. Despite that adversity, we issued a secondary sell probe against the September 5 th 366 high. The HUI topped one day later at 369.68 |
 From Elliott Wave technology's
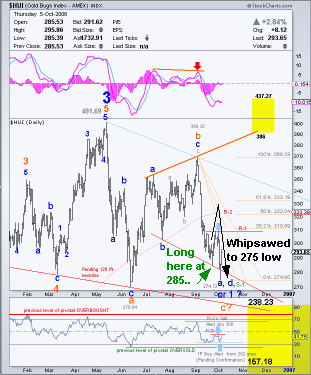
After taking our lumps, maintaining a stiff upper lip paid off. By the time mid-October rolled around, our secondary “sell probe” against 366 was well in profit as the HUI was down more than 20%. On September 25 th , (and once again too early on the draw) we suggested clients consider taking profits on shorts and initiate “buy” probes against the 285 low. Another short-lived move in our direction violently whipsawed against us. After moving up 24 pts in five days, the HUI did a complete about face, plunging to fresh lows 3% below our entry guidance before putting in a final bottom on October 4 th at 274.72. In similar fashion, that fresh new low only served in prompting us to issue secondary long side guidance against it. After licking our wounds, that 275 low marked bottom for the move. We had now adopted a long bias toward the HUI. |
 From Elliott Wave technology's
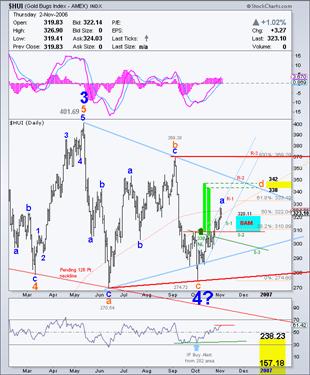
From our bullish stance against the 285 - 275 levels in early October, the HUI was now trading in the 320 area some four weeks later. After a 13% move up, we began to “size-up” and measure the next interim pivot high. Our work on Thursday November 2 cited an upside target window between 338 and 342 to gauge such a pivot.
|
 From Elliott Wave technology's
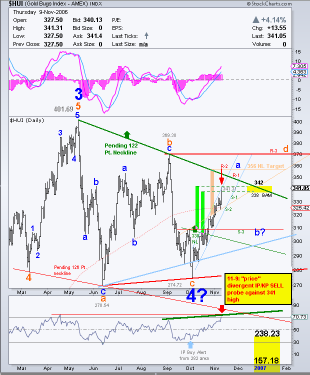
Within a week's time, the HUI managed to spike up as high as 341.31, just .69 cents shy of the top end to our capture window. This in concert with an overbought “price” divergence prompted us to issue guidance to take profits on longs and reverse to the short side of the market. This high would prove to be profitable over the next two weeks, but come back to haunt us with another major upside whipsaw. |
 From Elliott Wave technology's
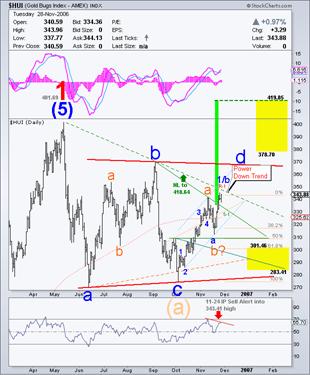
Within one week from our short probe against the 341 level, the HUI was trading nearly 6% lower under the 320 level. At that juncture, we assumed all was going according to plan; that is until the HUI decided to throw us some serious curve balls. By Tuesday November 28, all short side profits had totally evaporated. We suspect many clients aborted campaigns on the bullish pattern breakout above the inverted H&S neckline, or upon individual break-even levels, somewhere near the 335-340 handles. Staying with our discipline, we issued a secondary sell signal against fresh 343 highs on November 24. This signal ended up erroneous as well. This is the real world market environment. To engage it, one must graciously accept losses along with the gains.
|
 From Elliott Wave technology's
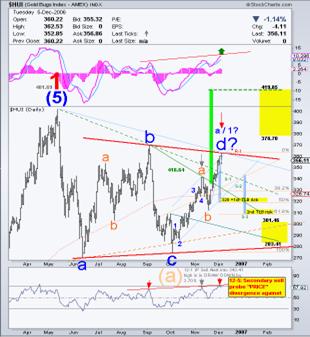
After getting our clocks sufficiently cleaned, we humbly maintained our confidence and disciplines in the face of such adversity, and continued with our work as usual. On Tuesday December 5, a second, and much more pronounced “price” divergence registered against the 362 high. With it, we now suspected that price was at or nearing its last leg up toward the preferred d wave in question. At this time, we issued guidance suggesting clients assume a bearish trading bias toward the HUI against this 362 high. |
 From Elliott Wave technology's
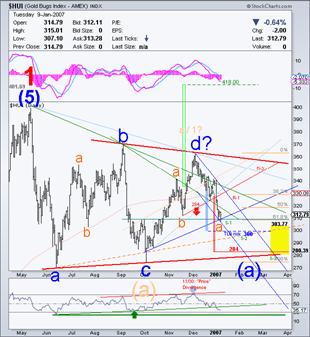
Buy January 9 th of the New Year, the bearish guidance delivered against the previous Decembers 362 high was now 50 points, or 13% in the black. This guidance went a long way in healing most all of the wounds incurred from our most recent rough patch. The battle scars remain however, and serve a very good cause. Such scars are constant reminders that taking losses, recognizing bad trades and prudently abandoning them, are as much a part of the real world experience as booking profits. Risk is always to be respected, and above all else, protecting one's trading stake takes precedence above all else. |
 From Elliott Wave technology's
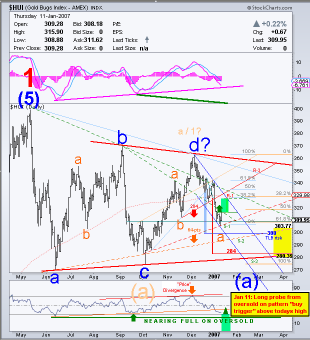
 After the impressive bullish run following the c wave lows in October, we were as convinced as one could be that the HUI would not trade in a straight line to the lower triangle boundary toward our then anticipated (a) wave terminal. As such, we began looking for reasons to lift the short bias, and reverse posture to the long side of the market. On January 11, the HUI was nearing a full oversold condition. The chart was also displaying a short-term “pattern buy” set- up. Cognizant that not all pivots require similar confirmations, we expressed bullish guidance for a potential interim pivot a wave low upon upside breakout of this impending bullish chart pattern. |
 from Elliott Wave technology's
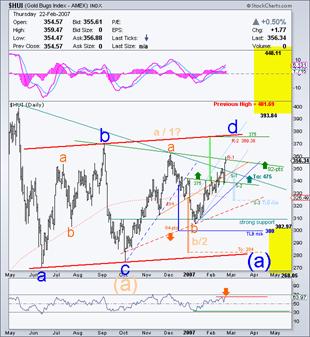
Results from the pattern buy signal- Frankly, our intuition paid off, and we got lucky as well. After breaking the pattern to the upside, following a brief retest, the HUI just kept moving higher. By February 22, though price was well shy of our then postulated upper boundary projection for the d wave; price reached underlying resistance while the HUI approached full on levels of overbought. With this, we issued guidance for clients to lift their bullish bias, and resume a bearish stance against February 22's 359 high. Notice the evolving and dynamic nature in which we adapt wave interpretations relative to the ongoing price action. |
 From Elliott Wave technology's
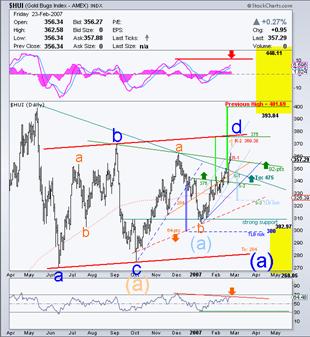
 One session following our bearish reversal guidance, the HUI pressed higher above underlying resistance, printing an intra-day high of 362.58 on the 23rd. Bearish guidance however, remained steadfast against this high as well. The 362.58 high ended up marking a rather profitable high pivot. |
 From Elliott Wave technology's
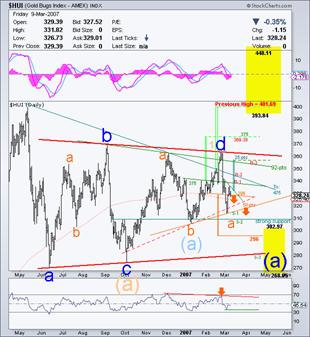
By early March, we found ourselves right back to anticipating the very same dynamics as in the previous January 11 analysis. Once again, we suspected that the anticipated (a) terminal would not arrive in a straight line. With this, we again began sizing up and measuring for counter move long positions off another intervening a wave pivot low. The take away is- So long as guidance remains on the correct side of most interim or key pivots, it matters not whether our anticipated larger wave labels prove to be correct. We use them to guide variant perception as to what may occur however, evolving market dynamics compel us to vary perception as price unfolds. In the mean time, we are free to navigate clients profitably throughout most pivots- whether the count dynamics change, or prove to be correct as originally perceived. |
 from Elliott Wave technology's
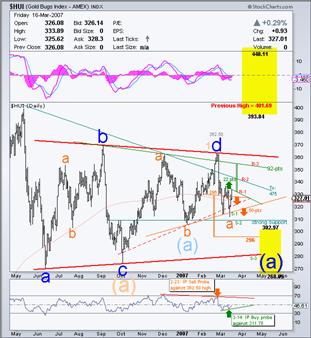
from Elliott Wave technology's near Term outlook mar 16, 2007 Our last chart in this presentation shows guidance reversing from a bearish to a bullish posture on March 14 th against the 312 low. This brings us to the present. Prior to pulling back last week, the HUI recently registered prints just north of 369. The HUI closed out last week's trade at 356.16, some 44 points or 14% above our mid-March bullish guidance. Since posting this chart on March 16, the count and labeling has changed significantly. One can attain our latest updates by becoming a Near Term Outlook client. |
![]()
It is readily apparent that our approach to forecasting is by no means arcane. We do not “predict prices;” nor become reliant upon previously stated predictions coming true; instead, we adapt to the dynamic price action as it unfolds, and do so in such a way that no black box algorithm could possibly match. Doing this impartially, allows us to anticipate direction and formulate astute and measured guidance based on the daily evolution of price. As evidenced in this fair and balanced real-world presentation, the resultant competitive advantages remain abundantly clear.
Trade Better / Invest Smarter…
By Joseph Russo
Chief Editor and Technical Analyst
Elliott Wave Technology
Copyright © 2007 Elliott Wave Technology. All Rights Reserved.
Joseph Russo, presently the Publisher and Chief Market analyst for Elliott Wave Technology, has been studying Elliott Wave Theory, and the Technical Analysis of Financial Markets since 1991 and currently maintains active member status in the "Market Technicians Association." Joe continues to expand his body of knowledge through the MTA's accredited CMT program.
© 2005-2022 http://www.MarketOracle.co.uk - The Market Oracle is a FREE Daily Financial Markets Analysis & Forecasting online publication.