Financial Markets Forecasts for 2009
Stock-Markets / Investing 2009 Jan 22, 2009 - 10:22 PM GMTBy: Nadeem_Walayat

 2008 was the year that collatorised debt obligations wiped out the capital bases of the west's biggest banks, which played itself out during September 2008 following the china syndrome chain reaction that followed the Lehman's bust that led to the unprecedented actions of capital injections and nationalisation of too big to fail banks that looks set to continue for the whole of 2009 and beyond. The crisis had been festering and growing since the August 2007 interbank market freeze due to flawed and some could say fraudulent mark to market valuation of worthless over leveraged mortgage backed CDO's.
The time bomb continued to tick under the bankrupt banks as to how long could the banks hide the truth from the market that they were insolvent. The article of September 9th (BANKRUPT Banks Wiped Out by Tulip Backed Securities, Is China Cheap?) in response to email queries of "should I buy banks now?" , clearly pointed out that banks should be avoided as the banking crisis had yet to hit the financial markets let alone the economies which were also soon expected to fall off the edge of the cliff as the second phase of the credit crisis kicked into gear. Meanwhile the more asset prices fell the more loss making illiquid positions forced more asset sales and therefore more deleveraging, which culminated in the crash of 2008. Deleveraging is not over and therefore suggests much lower asset prices during 2009.
Key Lesson from 2008
The key lesson from 2008 is that no matter how bad you thought things could get, they in fact got a lot worse in every respect, from the stock market panic of September / October 2008 to the financial system that came to the very edge of armageddon. This leads me to believe that being an optimist during 2009 could prove to be a fatal mistake, whilst the world is not going to end, well hopefully not, what it does mean is that the financial and economic crisis will get a lot worse and therefore which means much lower stock prices during the course of the year.
So no matter how bad 2008 was, 2009 could still be worse!
The Paradox of Deficit Spending Bailouts and Stimulus Packages
I may be wrong in my thinking here but there appears to be a huge paradox at the heart of the stimulus packages and banking system bailouts aimed at generating economic activity and this is that the record amounts of new government debt issued has the effect of soaking up liquidity from the financial system i.e. the US is expected to issue $2 trillion of treasury bonds during 2009, how much of that $2 trillion would have gone into main street ? Therefore this implies that whilst the public expects huge and highly inefficient stimulus packages to impact on the economy. However at the same time the deficit spending is quietly draining the financial system of liquidly, therefore main street by the end of 2009 will be wondering why the $trillion dollar deficits have had no impact on the economy. This also implies bond prices will fall, despite deflation.
Economic Contraction
The worlds economies are fast falling off the edge of a cliff with many expected to experience the worst recession since the Great Depression. Still economic contraction of between 2 and 3% per annum does not compare against that which occurred during the Great Depression which saw U.S. GDP contract by more than 30%. So YES, a severe recession that looks set to continue into 2010, but NO, not a Great Depression. Therefore I continue to stick with the conclusions of my analysis of October 2008, that discounted another Great Depression and therefore the current stocks bear market that has seen the general stock indices off by as much as 50% from their 2007 peaks and despite further falls during 2009 present long-term opportunities in several key sectors.
Forecasting 2009
The problem with each New Year is that there is a rush to get a string of forecasts out on various markets, however accurate forecasts are born out of indepth analysis which is not subject to an arbitrary date in a calendar. Therefore the following market forecasts for 2009 also include how confident I am at this point in time about the potential probability of the forecast outcome, i.e. some forecasts carry a greater probability of accuracy than others as preceding analysis has been born out of confirming price action rather than an arbitrary calendar date. The confidence levels range from a minimum of 50% to a maximum of 100%.
Then there are the Black Swan events of which there were many during 2008, events that cannot be allowed for by their nature that tend to rip forecasts apart. In 2008 one of the key events was the Russian invasion of Georgia that set the ball rolling for a collapse in the Russian stock market that had previously held up remarkably well. Therefore there will be many black swan events during 2009 that will severely impact on financial market trends, which makes forecasting of markets that are more susceptible to black swan events such as crude oil for example being impacted by an attack against Iran's nuclear infrastructure (highly improbable but not impossible). However should it occur, then that would immediately negate the existing forecast.
US Dollar Forecast 2009
Prevailing bearishness continues against the U.S. Dollar amidst a near infinite reasons of why the Dollar is doomed. But as an active experienced trader, one thing you soon painfully learn is that the fundamentals don't count when it comes to trend reversals, as by the time the reasons have become apparent the market has already moved by as much as 50% and even then there exists the continuing dilemma of the trend versus the fundamental views based on hard data. However as I have discussed several times with would be traders in that your trading the price not the indicator or data. The bottom line is that what the price says is that which only 'should' count.
Whilst we are on the topic of trading, my new trading orientated site walayatstreet.com will shortly to go live which will aim to freely share my whole trading methodology developed over the past 20+ years as well as publicise trade points in addition to on-going longer-term analysis.(temporarily points to my Market Oracle archive)
It's not all fundamental gloom for the U.S. Dollar, there do exist a number of reasons that support a bullish dollar from a fundamental basis, as I elaborated upon during 2008, namely that of deleveraging, deflation and the US Dollar as the worlds reserve currency which allows the U.S. to print money without experiencing an Iceland style currency collapse, and therefore has an advantage over other distressed currencies such as the British Pound. Still a trader needs to be always aware of the technical state of the market and be prepared for corrections and the possibility of trend reversals, and in that regard this update seeks to a. Determine if the US Dollar Bull market remains intact in response to price action of the past 3 months, and b. Attempt to forecast a probable trend for at least the next few months.
Brief Recap of U.S. Dollar Bull Market Updates During 2008
1. March 2008 - Dollar Bear Market Bottom called, initial target of 80. (DELEVERAGING- Gold and Commodities Teetering on the Brink of a Bear Market?)
2. August 2008 - Dollar Base building complete - breakout targeting USD 80 (The US Dollar Bull Market)
3. October 2008 - Expecting USD to correct after rallying to between 87and 90, targeting support at 80, to be followed by a resumption of the up trend targeting USD 92. (U.S. Dollar Bull Market Update)
U.S. Dollar Forecast 2009
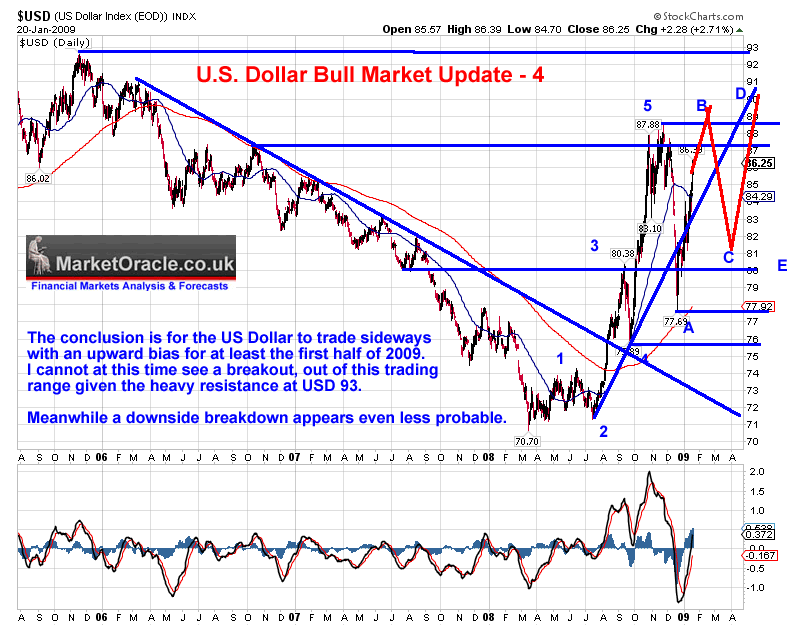
TREND ANALYSIS - The correction following the November peak was more severe than expected this implies weakness, however the US Dollar did hold above the previous low of 75 before resuming the up trend. Immediate resistance lies at 88, given the violence of the correction this implies choppy volatile trading in the region of between 80 and 90, this is inline with the conclusion of October 2008 with regards trend expectations for 2009.
PRICE TARGETS - The upside price target for USD remains at 90 and then 92. The USD has significant resistance above USD 92 and therefore suggests the USD will find it tough to sustain a breakout above USD 93. This suggests a trading range with an upward bias. The key here is for the USD to continue making higher lows, with the last low being 77.7.
MACD - The MACD was extremely oversold and has helped contribute to the U.S. Dollar turnaround, how-ever the MACD has some way to go before it reaches what could be termed as an overbought state and therefore implies more immediate term U.S. Dollar strength.
SEASONAL TREND - The USD Rally into January is inline with the seasonal tendency, which suggests a corrective February.
ELLIOTT WAVE THEORY - Octobers elliott wave analysis proved accurate, given the power of the corrective wave, this suggests a more complex sideways elliott wave pattern during 2009 rather than a breakout higher.
US Dollar 2009 Forecast Conclusion
The conclusion is for the US Dollar to trade sideways with an upward bias for at least the first half of 2009, as the above graph illustrates. I cannot at this time see a breakout, out of this trading range given the heavy resistance at USD 93. Meanwhile a downside breakdown appears even less probable.
USD 2009 - Side Ways range trading with upward Bias Targeting resistance at $92 and Support at $80 - 80% Confidence
Dow Jones Stock Market Forecast 2009
Looking forward a week is hard enough let alone 12 months, Still, the in-depth analysis of October 2008 - Stocks Bear Market Long-term Investing Strategy that accurately forecast a 20% corrective rally (that appears to have terminated) and a subsequent stocks bear market low in Mid 2009, with a strategy of scaling into the market at the rate of 10% of funds allocated to stock holdings per each month that the market is within 10% of its lows. The bear market rally following the November lows has been weak, which does not bode well for stocks, as the hope associated with the Obama rally appears to have evaporated.
The October analysis still stands and has been reinforced by subsequent events that point towards a break of the November low, how low will stocks go? Its a tough call as there is too much subsequent trend to overcome, but Dow 6000 would be the worse case scenario. In fact Dow 6,000 is indelibly printed on my mind, for it was at that price more than a decade ago that Greenspan uttered his famous Irrational Exuberance speech, given that at the time he was seen as the Maestro that spooked many speculators and investors into taking a step back from bullish positions and pondering whether or not a bearish trend was imminent, well the rest is history!. I guess the lesson here is that when the Fed chairman is bearish and warning of doom, be bullish, if the Fed chairman is making optimistic announcements be bearish!
The technical picture is that of a weak market, the corrective rally could resume but it is too weak to imply that any significant trend reversal is taking place hence the lows will very likely be breached. However I do still expect the mid 2009 low to mark a significant low from which there will be an initial strong bounce into 2010 . Now the question is where will the stock indices close by year end ? Well that will depend on where the low is !, as I expect at least a 30% bounce from the lows into December, therefore if stocks put in a double bottom (unlikely) at say 7,500 that would suggest an year end Dow of 9,750 (December 09). On the other hand if the market crashes through the November lows amidst another panic towards 6,000 (appears more probable) then the minimum 30% rally to year end would take the market to 7,800 during December 2009. Which means that the closing forecast for the indices will be much clearer by mid 2009, as the below graph illustrates with the most probable trend as follows:
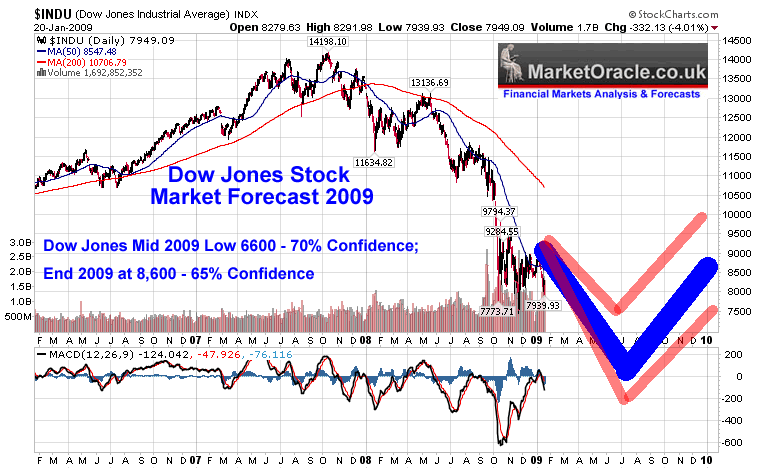
In Conclusion , I do not know at precisely what price level the Dow will make a low during 2009, my best estimate at this time is 6,600, but I am expecting that it will mark the start of a multi-year bull market that will eventually make 2008-2009's price action appear as a mere minor blip, much as the 1987 crash appears on today's price charts.
Dow Jones Mid 2009 Low 6600 - 70% Confidence; End 2009 at 8,600 (During December 2009) - 65% Confidence
FTSE 100 Index Forecast 2009
I am expecting the FTSE stock market index to follow a similar trend to the Dow Jones, however the ongoing currency crash means that the FTSE 'should' perform relatively more strongly than the Dow as a consequence of the exchange rate movement. The bear market rally following the October low has been very weak, which suggests much lower trading than the October low.
On balance the October analysis still stands and has been reinforced by subsequent events that point towards a break of the October low of 3665, how low will stocks go? A break of 3665 would trigger a trend towards the previous 2000-2003 bear market low of 3277, with strong support at 3,000. However that would be a worse case scenario.
The current technical picture is that of a weak market, the rally could resume but it is too weak to imply that any significant trend reversal is taking place hence the 3665 low is very likely to be breached. However I do still expect the 2009 low to mark a significant low from which there will be an initial strong bounce into 2010 . Now the question is on where will the stock indices close by year end ? Well that will depend on where the low is !, as I expect at least a 35% bounce from the lows to year end ,therefore if stocks put in a double bottom at say 3,700 that would suggest an year end FTSE of 5,000. On the other hand if the market crashes through the October lows amidst another panic towards 3,400 (appears probable) then the minimum 35% rally to year end would take the market to 4,600 during December 2009. Which means that forecast for the FTSE into December 2009 will be much clearer by mid 2009, as the below graph illustrates with the most probable trend as follows:
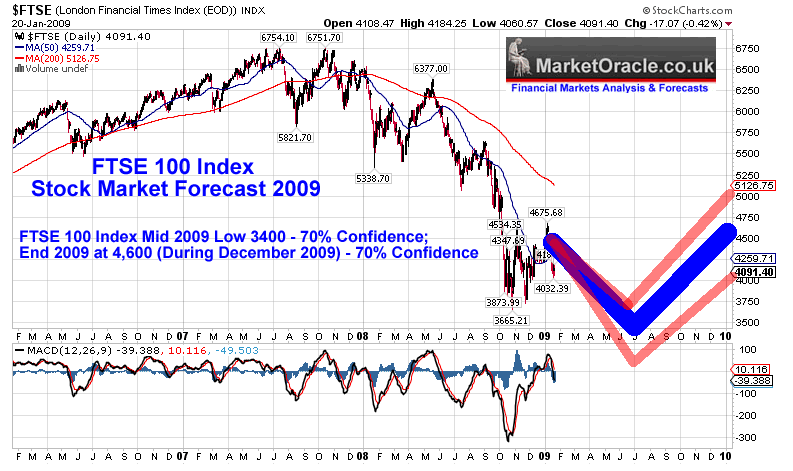
In Conclusion - The FTSE looks set to break below the previous low, however I expect the FTSE to outperform other indices with a minimum 35% move from the years low and finish Up on the year, my best estimate at this time is for the FTSE to trade at 4,600 or higher during December 2009. Also I am expecting that 2009 will mark the start of a multi-year bull market that will eventually make 2008-2009's price action appear as a mere minor blip, much as the 1987 crash appears on today's price charts.
FTSE 100 Index Mid 2009 Low 3400 - 70% Confidence; End 2009 at 4,600 (During December 2009) - 70% Confidence
Two Point Stock Market Investing Strategy for 2009.
a. 2009 will be great time to scale into long-term investments at bargain basement prices. Even if stocks fell by another 20%, that should be more than made up for in subsequent years as great bull markets are born out of the most pessimistic market conditions! My october strategy called for a 10% per month investment of funds allocated towards stock market investing in each month where the index trades to below 10% from its bear market low to date. The October article also listed the key mega-trends to focus on such as Global Warming, Peak Oil, Rise of Asian Middle class and Population growth as the sectors to focus on that are expected to outperform the general indices over the long-run.
b. 2009 Will be an even greater year for trading the markets as was 2008, and in that respect my new site walayatstreet.com will be aimed at position trading including hedge fund style trading tactics which will be going live shortly that aims to freely share my whole trading methodology honed over the past 20 years AND to publicise trade points and ongoing analysis. In the meantime the site lists my existing longer range analysis and commentary.
Remember - STOCK MARKETS MOVE AHEAD OF THE ECONOMIC DATA AND NEWS, Therefore Focus on the Trend rather than the Bad News of which there will be plenty during 2009 as global economies contract.
Gold Price Forecast 2009
My existing forecast for Gold price trend during 2009 as of October 2008 has been for a volatile sideways trading range of between $930 and $700, subsequent price action has so far been in line with this. Therefore this analysis seeks to update the Gold Price expectations for 2009 in the light of "Quantative Easing" aka "Money Printing" as many gold investors are taking their cue from the recovery in gold stocks for much brighter prospects for gold to target a breakout to new highs during 2009.
TREND ANALYSIS - The rally from the October 681 low as expected failed to break above the previous peak of $936, peaking at $892, the subsequent price action has taken gold to a recent low of 800. The trend pattern continues to exhibit lower highs and lows which is a sign of weakness. Clearly gold needs to a. Make a higher low and b. Break the previous peak of $892 before the volatile but bearish sideways trend can change. Therefore the price pattern action still supports that of an overall trading range in the $920 to $700 region. The down sloping trendline continues to contain rallies, the first sign of positive developments would be for a break above this trendline.
PRICE TARGETS - There exists heavy support in the region of $725, and resistance in the area $870 to $930 which has had the tendency of suckering in weak money towards these support and resistance areas before each new swing in the opposite direction.
MACD - The MACD indicator has proved accurate so far in gauging gold price trend, current MACD suggests that there is more downside in the immediate future which targets a revisit to $800.
SEASONAL TREND - October to March is usually the strongest seasonal period for gold, current price action is inline with the seasonal tendency which suggests that if Gold is to break above resistance than the time to do that is in this period i.e. now. This therefore suggests gold could break above resistance in the coming weeks, to target $980, and thereby change the pattern for 2009 towards a range of $1000 to $800, rather than $920 to $720.
ELLIOTT WAVE THEORY - Elliot wave theory suggests a 5 wave decline to the October low, which implies the current rally is corrective and that the $681 low will likely be revisited.
Gold Forecast 2009 Conclusion
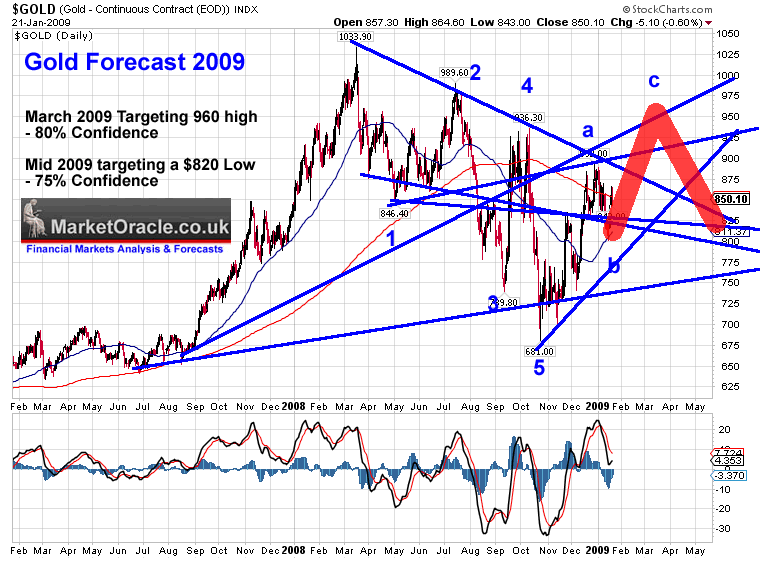
The picture being painted by the above analysis is that of gold strength going into March that looks set to see gold break above resistance of $936, to target $960, however this strength will soon evaporate with gold again targeting a decline back below the breakout point to trade back below $850 by mid 2009.
Gold Forecast - March 2009 Targeting 960 high - 80% Confidence; Mid 2009 targeting a $820 Low - 75% Confidence
Chris Vermeulen presents excellent coverage of Gold trading by utilising ETF's in his commentary and newsletter.
U.S. Treasury Bond Forecast 2009
The explosive long T-bond rally of November and December 2008 following deep U.S. interest rate cuts towards ZERO appears to have come to an end as treasury bonds broke below the previous most recent low. Therefore this analysis seeks to determine if the bond bubble is about to burst and how bonds could trend during the next 5 months of 2009.
TREND ANALYSIS - Treasury bonds spiked higher on breakout of a well established trading range between 122 and 112. The break below the previous low of 132 threatens a retracement of the whole move back into the 122-112 zone. The Initial target for the decline is the upper end of the range i.e. 120 to 122.
MACD - MACD has reversed strongly from extremely overbought condition and suggests that bonds could decline towards extremely oversold conditions, which supports the view of a decline towards 120.
SEASONAL TREND - The November / December rally is inline with the seasonal tendency for T-bonds, which is usually followed by a bearish trend from February to April. This suggests there may be a delay in the bond market rally after the initial sell off.
ELLIOTT WAVE THEORY - Elliott wave suggests that a significant correction is underway that is correcting the whole move from 105 to 142. The initial target for which is 38.2% at 128. With the more probably 61.8% correction targeting a move to 119, and therefore confirms trend analysis expectations.
U.S. Treasury Long Bond Forecast 2009 Conclusion
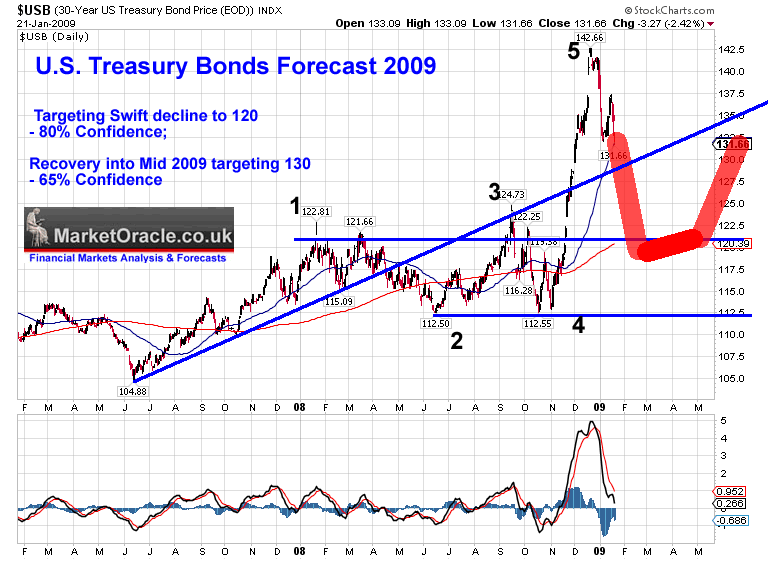
Conclusion - The U.S. Bond bubble is bursting (temporarily?) at this time there is a high probability of bonds declining back into the 119-120 range. Beyond that there are expectations of a corrective rally, which suggests a 61.8% retracement of the decline eventually back into the 130 region as the above graph illustrates.
30 Year U.S. Treasury Bond Forecast - Targeting Swift decline to 120 - 80% Confidence; Recovery into Mid 2009 targeting 130 - 65% Confidence
Crude Oil 2009
After crude oil hit its 2008 target of $150 ($147 actual), My analysis during July 2007 concluded that that crude oil was going to experience a deflationary crash over the next 6 months towards an initial target of USD $80. Subsequent indepth analysis of 8th December forecast crude oil to formulate a bottom that I expect will form a very volatile double or even triple bottom pattern i.e. protracted bottom formation punctuated with very sharp short-covering rallies that could see crude oil spike as high as $80 and declines back to to the lows over the next 12 months. What this anticipated scenario means is that there is TIME for investors to buy into crude oil positions as the base building confirmation takes place, as any strong rallies will likely be followed by tests and probable breaks of the previous low so as to enable the creation of the overall saucer shaped double or triple bottom pattern.
However the long-term trend for crude oil remains higher, when I mean long-term I am looking at well beyond the next 12months towards 5 to 10 years, when I would not be surprised given the peak oil fundamentals that we will actually be visiting the $200 crude targets that were loudly pronounced during mid 2008 as being imminent when crude oil was trading at $147. This scenario should not be surprising given that the US Dollar bull market remains in tact that will continue to bear down on commodities during 2009.
In Summary, Oil prices will remain weak and develop a saucer shaped pattern despite spikes higher, don't expect any sustainable up trend whilst the major economies continue to contract- Confidence 80%; Year End Price ? $44 - Confidence 65%.
UK House Prices Forecast 2009
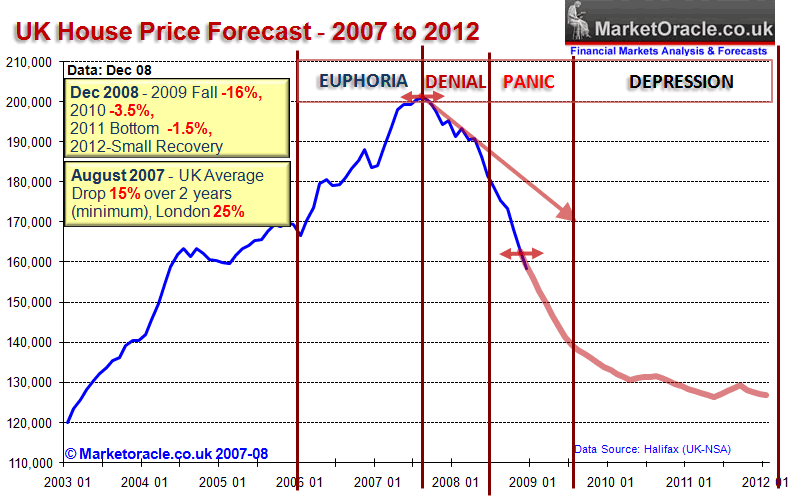
UK house prices continued to crash lower, with the latest data from the Halifax showing average house prices falling by £4,400 in December. The house price data is inline (-0.5% deviation) with the recently updated house price forecast that covers the trend into 2012 that projects for a total drop from peak to trough of 38%, with a 16% drop in house prices targeted for 2009 to be followed by a sustained depression for several years thereafter as the below graph illustrates.
UK Interest Rates 2009
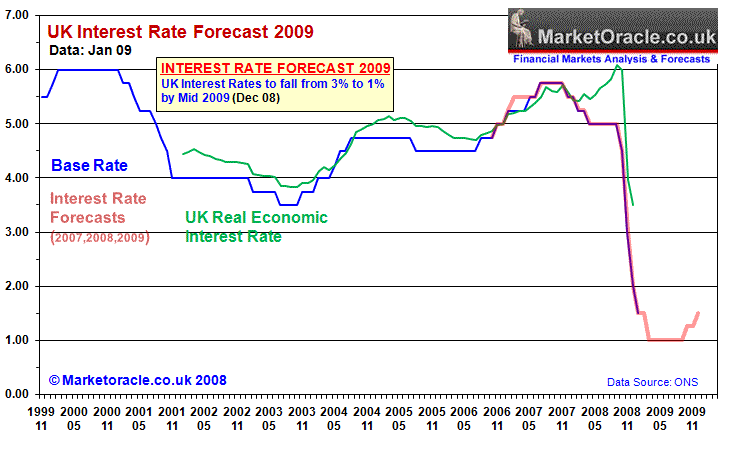
January's interest rate cut of 0.5% for January is inline with my forecast for interest rates to target a fall to 1% by mid 2009 as the below graph illustrates. However given the deteriorating state of the UK economy there is a risk that rates could overshoot to the downside during mid 2009 by falling below 1%. As the credit markets have frozen the real economic rate has become far less responsive to base rate cuts, therefore the latest cut is expected to make very little difference to the severity of the recession, thus the buzz word for 2009 is "Quantative Easing" which basically means printing money, the consequences of which will be higher inflation as we come out of economic contraction.
UK Inflation / Deflation 2009
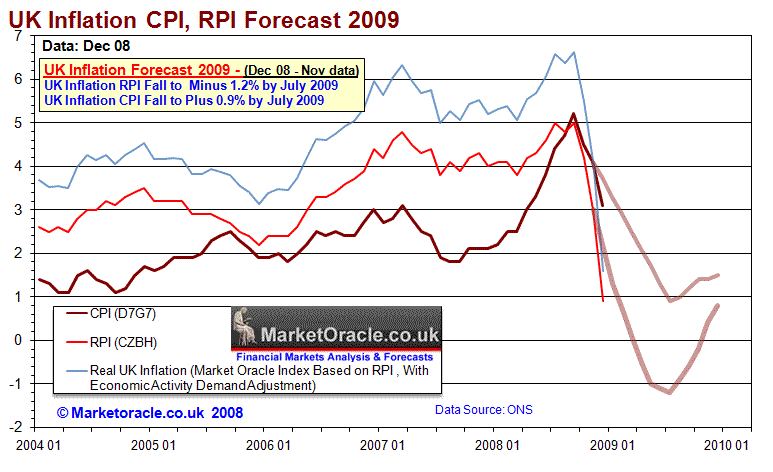
My earlier analysis of the UK inflation concluded that the UK is heading for real deflation during 2009, with the RPI inflation measure expected to go negative by mid 2009 by targeting -1.2%. The expectations are for similar deflation across the world, as deficit spending stimulus packages cannot hope to compete against the loss of asset values which are in the order of ten times the amount of planned stimulus. The analysis also concluded in that the risks to the forecast are to the downside i.e. inflation spiking lower than expected. This therefore implies for further stimulus packages far beyond that which have been committed to date, with all of the associated consequences of collapsing currencies under the weight of growing deficits and liabilities which sets the scene for future inflation and even risks the bankruptcy of some countries such as Britain.
In conclusion 2009 will witness a severe recession, but NOT a Depression, with asset prices expected to deflate further during the year, this presents opportunities to accumulate commodities and stocks at rock bottom prices for the long-run. The key sectors to focus on are those that will recover first and are showing relative strength during the bear market, therefore oil and gas companies, dividend paying utilities and other commodities stocks. Beyond that looking towards long term positions in crashed emerging markets such as Brazil, Russia, India and China (BRIC's), and then to a lesser degree the developed economies of Canada and Australia. Also battered and bruised tech stocks such as Microsoft are starting to look appealing on current valuations or lower in response to further selloff's.
By Nadeem Walayat
http://www.marketoracle.co.uk
Copyright © 2005-09 Marketoracle.co.uk (Market Oracle Ltd). All rights reserved.
Nadeem Walayat has over 20 years experience of trading derivatives, portfolio management and analysing the financial markets, including one of few who both anticipated and Beat the 1987 Crash. Nadeem's forward looking analysis specialises on the housing market and interest rates. Nadeem is the Editor of The Market Oracle, a FREE Daily Financial Markets Analysis & Forecasting online publication. We present in-depth analysis from over 250 experienced analysts on a range of views of the probable direction of the financial markets. Thus enabling our readers to arrive at an informed opinion on future market direction. http://www.marketoracle.co.uk
Disclaimer: The above is a matter of opinion provided for general information purposes only and is not intended as investment advice. Information and analysis above are derived from sources and utilising methods believed to be reliable, but we cannot accept responsibility for any trading losses you may incur as a result of this analysis. Individuals should consult with their personal financial advisors before engaging in any trading activities.
Attention Editors and Publishers! - You have permission to republish THIS article. Republished articles must include attribution to the author and links back to the http://www.marketoracle.co.uk . Please send an email to republish@marketoracle.co.uk, to include a link to the published article.
Nadeem Walayat Archive |
© 2005-2022 http://www.MarketOracle.co.uk - The Market Oracle is a FREE Daily Financial Markets Analysis & Forecasting online publication.


