


Bond Market Payment Rates Analysis
Interest-Rates / US Bonds Jan 27, 2009 - 08:01 AM GMTBy: Richard_Shaw

 Bond rates are easy to access, but understanding what you are being paid for the components of bond rates takes a little bit of simple math to break it down. Important insights can be gained from knowing the building blocks of a rate.
Rates for key bond types are published by multiple public internet sources. You may need to go to more than one to get all the detail you want.
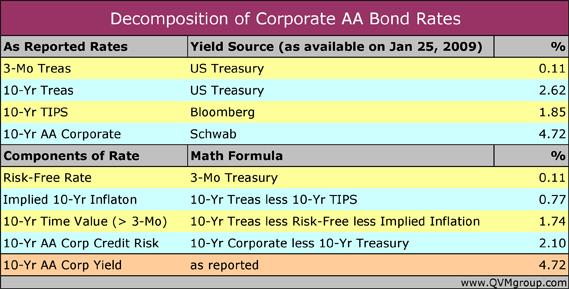
Let's look at the elements of the rate for the 10-year period which is commonly used to judge stock valuations.
The basic idea is that rates can be dissected, and that somehow in its overall wisdom the markets effectively (though perhaps not consciously) build rates from the ground up. However the rates are built, we can still tear them apart to inspect the pieces.
The building blocks (or dissection components) are:
- the short-term credit-risk-free rate
- the implied inflation rate for the period of the bond
- the full-term (less short-term) credit-risk-free rate
- the credit-risk rate (if Treasuries, this is zero)
From the table above, you can see that the implied 10-year annualized inflation rate is 0.77%, and the credit risk component for 10-year AA corporate bonds is 2.10%.
This sort of decomposition of bond rates could be useful in a few different ways:
- You can inspect the valuation of the parts, to see if you agree that the market is fairly valuing the whole
- You can see how much of corporate bond return is from credit risk, and then compare that to loads and expenses in any corporate bond fund you may consider holding
- You can build up from the corporate bond rate with a stock risk component to judge the earnings yield (inverse of P/E) that you feel is appropriate for stocks overall.
For example:
- We are a bit skeptical about the next 10 years experiencing an average of only 0.77% inflation (unless there will be so much deflation now as to lower the average when higher inflation arises later). Maybe bond yields are too low, and if they aren't maybe we have worse short-term deflation in front of us than is priced into stock.
- With only 2.10% of the total AA corporate bond yield coming from risk greater than that of buying Treasuries, which anybody can do with no effort and no skill, we certainly wouldn't want to spend too much of that on fund loads and expenses. This is an example of why we would never buy a load bond fund, and would never buy a high expense ratio bond fund. There are corporate bond funds out there with 4% to 5% loads and 1+% expense ratios that virtually consume all or more of the value of owning corporate bonds over Treasuries. Avoid those funds like the plague. Then there are corporate bond funds with no loads and low expenses, such as the Vanguard bond mutual funds or the Barclay's investment grade bond ETF (LQD) that charges only 15 basis points.
- If we add the credit risk element onto the total corporate bond yield to gauge a minimum earnings yield for overall stocks (and better yet at least 3% for overall stock risk), we get a necessary earnings yield of 6.82% (or 7.72% if we set 3% as a minimum stock risk premium over AA bonds). That translates to a 13.0 to 14.7 “fair value” stock market P/E. The approach may be helpful for determining how interest rates cause the fair value P/E to float around an historically central value of about 15 which is not calibrated to interest rates at any particular time. That does nothing, however, to settle on the “E” to be used with P/E, or the growth rate of “E”, which are other topics altogether.
You may find other uses and may draw different conclusions about inflation and fair value stock earnings yields, however, looking at yields as the sum of the parts can sometimes be helpful — similar to the value stock analysts often find in adding up the value of the separate businesses under one holding company stock.
A similar analysis of the components of municipal bond yields can be done, by adding your tax rate and calculating the taxable equivalent yield of the municipal bond.
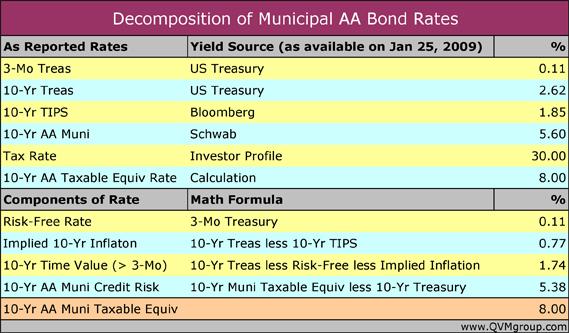
Right now, typical 10-yr AA municipal bonds are paying a taxable equivalent of 8.00% for 30% tax bracket investors, which translates to 5.38% for the credit risk component.
The taxable equivalent yield spread between the credit risk component for 10-yr AA corporates and 10-yr AA municipals is 3.28%. That is a large spread by historical standards.
Muni's will likely be of increasing interest to investors during 2009, given their high taxable equivalent yields and the probability of increased federal, and perhaps state, tax rates.
As with corporate bonds, if you invest in a bond fund (such as MUB, the Barclay's ETF, or municipal bond mutual funds), pay close attention to costs, which make a big difference in your bond returns.
By Richard Shaw
http://www.qvmgroup.com
Richard Shaw leads the QVM team as President of QVM Group. Richard has extensive investment industry experience including serving on the board of directors of two large investment management companies, including Aberdeen Asset Management (listed London Stock Exchange) and as a charter investor and director of Lending Tree ( download short professional profile ). He provides portfolio design and management services to individual and corporate clients. He also edits the QVM investment blog. His writings are generally republished by SeekingAlpha and Reuters and are linked to sites such as Kiplinger and Yahoo Finance and other sites. He is a 1970 graduate of Dartmouth College.
Copyright 2006-2009 by QVM Group LLC All rights reserved.
Disclaimer: The above is a matter of opinion and is not intended as investment advice. Information and analysis above are derived from sources and utilizing methods believed reliable, but we cannot accept responsibility for any trading losses you may incur as a result of this analysis. Do your own due diligence.
Richard Shaw Archive |
© 2005-2022 http://www.MarketOracle.co.uk - The Market Oracle is a FREE Daily Financial Markets Analysis & Forecasting online publication.