


U.S. Dollar Hits Resistance as Gold Uptrend Remains Firm
Commodities / Gold & Silver 2009 Feb 15, 2009 - 05:37 PM GMTBy: Merv_Burak

 Another week on the up side for gold and silver. Even the U.S, Dollar Index gained during the week. Is this supposed to happen? The Dollar is starting to look weak, see my brief analysis below.
U.S. Dollar Index - The following is just a brief view of the U.S. $ Index and intended to highlight a feature that I think is warning us of problems ahead for this currency. The chart represents the U.S. $ daily action along with a momentum indicator suggesting the strength of this daily action relative to an intermediate term time frame. A few support/resistance trend lines are thrown in for good measure.
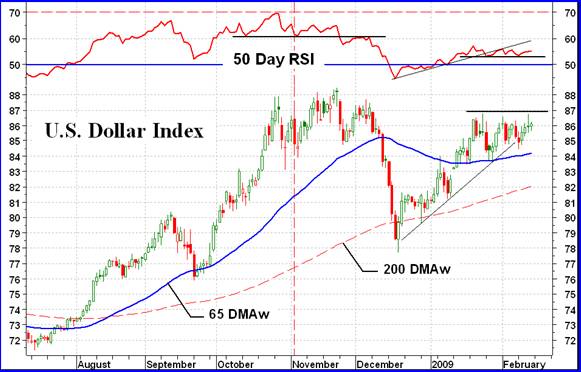
The strength of the daily $ action reached its peak, relative to the intermediate term time frame, the week before the election of the new U.S. President. The election date is shown as the vertical red dash line. Following the sharp $ drop on Election Day the $ went into a rally taking it to new recent bull market highs. The momentum indicator was just not confirming the move. It couldn't even gain enough strength to exceed its level from the day before the election. This weakness in the strength of the move ended the move and on the 24 th of Nov the momentum support level was breached. Despite an attempted short bounce in the $, down it went.
The rally in the $ since mid-Dec is impressive except for the strength of the move as represented by the momentum indicator. The strength of the rally was improving with the $ rally but at a much muted level. It barely got above its 50% neutral strength level, and that's where it sits. While the $ has been making higher lows over the past month the momentum indicator has been setting up a support level. So, what to expect from here?
As a technician who goes by the rule that a trend in motion remains in motion until the reversal has been conformed, I must remain positive at this point until the action actually says otherwise. Looking at the weakness of the momentum recently I have grave doubts that the $ will make it to the 87 level. Should it close at or above the 87 level AND the momentum indicator move above its recent high from mid-Jan I would then feel more at ease with the trend. However, should the momentum drop below its support, indicating continued weakness in the strength of the $, and the $ drop below 84, then I would be inclined to say that the bull trend has ended and we are back to the down side with the $.
With the weakness shown in the strength of the recent rally it is my guess that we will not see 87 on the $ but that the down side will take over again very soon.
What does this portend for the price of gold? Well, if the $ should turn and continue on its downward path then that should be a huge positive for the price of gold. However, gold and gold stocks are looking weak (see below) so something's gotta give.
GOLD : LONG TERM
Gold just keeps plugging away on the up side with a day or so interspersed to take a rest. It may continue to move higher but so far the trip has not been with too much enthusiasm. A day here and a day there with huge moves do not make for continued enthusiasm. However, the direction remains upward and one stays with the trend in motion.
Gold continues to trade above its positive sloping long term moving average line. The momentum remains in the positive zone and above its positive trigger line. The volume indicator continues to look good and is above its positive long term trigger line. In addition, the long term P&F chart continues to trend ever higher. The long term rating is therefore BULLISH.
INTERMEDIATE TERM
The intermediate term also continues to look good. Gold continues to move higher above its positive moving average line. The momentum indicator remains in the positive zone above its positive sloping trigger line. The volume indicator continues to move above its trigger line. All in all everything is positive and the rating remains BULLISH.
SHORT TERM
On the short term gold has moved into new recovery highs. However, the short term momentum indicator is giving us some concern. As the price of gold moves higher the momentum indicator can only track in a lateral direction. The latest action has given us a negative divergence versus the gold price. At this time it is not yet of any great concern but if the divergence or lateral move continues, with an upside gold action, then one would get more concerned and look at a possible reversal of trend. For now everything is still positive with the rating remaining BULLISH.
As for the immediate direction of least resistance, I would have to go with the down side here. The move by gold on Thursday into new recovery highs was not followed by the momentum indicator. The Stochastic Oscillator has entered its overbought zone and has started to top out although it remains in the overbought zone. The odds are turning towards the negative as being the most obvious direction.
SILVER
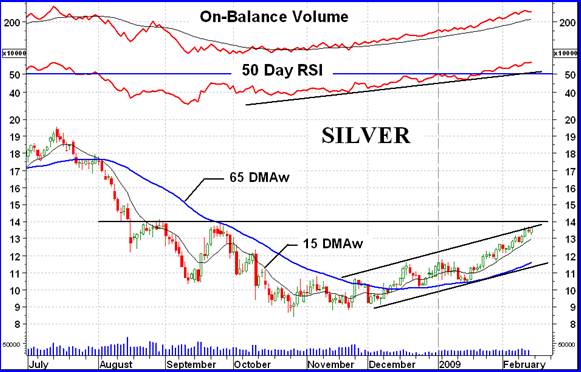
Once again silver has out performed gold, if only slightly, on the weekly basis. The chart shows silver recovering nicely but it is coming up to a resistance level which may just halt its beautiful advance. Despite hitting up against the upper resistance trend line of its channel and just about to hit that resistance at the $14 level there is really noting specific that one can grab on to and say that the upside move is over. I guess it will be over when it's over. For now I would usually be inclined to go with the flow but in this case I think I would be more inclined to hold back any further buying and be ready to sell, should things suddenly sour.
Despite being cautionary on the immediate future direction of silver I still must follow the chart and indicators as far as determining where we actually stand with silver. My favorite time period is the intermediate term and from that period everything is still moving positively. Silver is still above its positive sloping moving average line. The momentum indicator continues to move higher inside its positive zone and above its positive sloping trigger line (not shown). The volume indicator is moving up very nicely and remains above its positive trigger line. With all that I must maintain my BULLISH rating for the intermediate term. On the long term everything is now likewise positive except that the moving average has stopped sloping downward but has not yet started a positive slope. It has been horizontal for a few days and should turn upwards momentarily. Still, the rating here too is BULLISH . As for the short term, we have a slightly different problem. All indicators are positive but the momentum indicator is now in its overbought zone and may be preparing to reverse direction signaling a possible reversal of the price. This is a short term warning and should the reversal come to pass it is expected to be short term. We'll have to then watch the other time period indicators for an indication that it might be worse than that, but that's some time into the future.
PRECIOUS METAL STOCKS
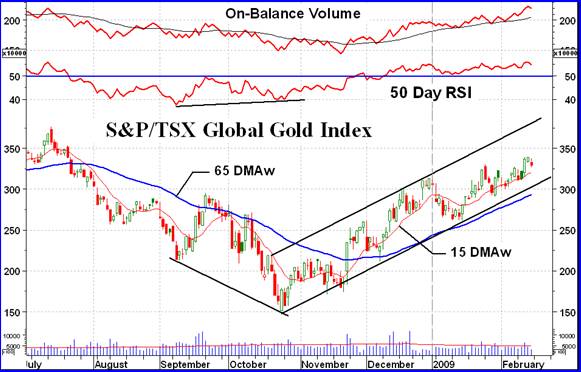
I thought I'd show one of the major North American gold Indices today. They are all very similar in their recent performance so I thought the S&P/TSX Global Gold Index would be the best representation, besides it's the only Index that I have with daily volume data. Although the Index is influenced by currency differences between Canada and the U.S. since October the Canadian Dollar has basically been static versus the U.S. Dollar so the currency fluctuations would have little impact here.
One can see the positive divergence between the momentum indicator versus the Index, last Sept and Oct. These divergences so often are correct in their message that one would be taking inordinate risk by investing in contradiction to the message, until the message has been nullified. But to the present.
Although we do not have a negative momentum divergence we do have a momentum indicator that is showing weakness in the recent Index move. Since early December as the Index continued to move higher in steps the momentum indicator has basically been moving sideways. This does not really indicate a worsening of strength, only that the strength of the recent Index moves is not improving. In addition, with the momentum value just above its neutral line that suggests the strength itself is very little better than neutral. Bullish moves need the strength behind their move to be a hell of a lot better than this for longevity of the move.
The other cautionary indicator is the daily volume action. Since the October low most of the trading has been to the up side. As such the cumulative volume indicator (On-Balance Volume) shows a positive trend. It's when you go to the daily activity that one gets a cautionary indication. At the bottom of the chart I have drawn a three month daily volume moving average line. Since early in the recent market advance the daily volume has remained very low. It has caused the average volume line to continue to decrease but still the daily volume remains below this average. The past two months as the Index made three new separate highs the average daily volume continued to decrease. This is not an action indicative to strength.
Although the indicators and trend are all still positive, and may remain so for some time, the warning signs are starting to come in that one should not be surprised if the trend should reverse.
Merv's Precious Metals Indices Table
Let's call it another week
By Merv Burak, CMT
Hudson Aero/Systems Inc.
Technical Information Group
for Merv's Precious Metals Central
For DAILY Uranium stock commentary and WEEKLY Uranium market update check out my new Technically Uranium with Merv blog at http://techuranium.blogspot.com .
During the day Merv practices his engineering profession as a Consulting Aerospace Engineer. Once the sun goes down and night descends upon the earth Merv dons his other hat as a Chartered Market Technician ( CMT ) and tries to decipher what's going on in the securities markets. As an underground surveyor in the gold mines of Canada 's Northwest Territories in his youth, Merv has a soft spot for the gold industry and has developed several Gold Indices reflecting different aspects of the industry. As a basically lazy individual Merv's driving focus is to KEEP IT SIMPLE .
To find out more about Merv's various Gold Indices and component stocks, please visit http://preciousmetalscentral.com . There you will find samples of the Indices and their component stocks plus other publications of interest to gold investors.
Before you invest, Always check your market timing with a Qualified Professional Market Technician
Merv Burak Archive |
© 2005-2022 http://www.MarketOracle.co.uk - The Market Oracle is a FREE Daily Financial Markets Analysis & Forecasting online publication.