


Stock Markets Relief Rally or New Bull?
Stock-Markets / Stocks Bear Market Mar 11, 2009 - 05:44 AM GMT

 I said the following in my “ Words from the Wise ” post on Sunday: “At this juncture, short-term movements are almost impossible to predict, although the sell-off over the past few days - a capitulation in some respects - could nourish the long-awaited tradeable rally. Also, Lowry 's 90% down-days , like we experienced on Monday and Thursday, are often followed by two- to seven-day bounces.”
Global equities surged yesterday as investors adopted a more positive view of the prospects for the banking sector and shrugged aside gloom about the economy. The reversal in fortune is illustrated by the strong gains of the MSCI World Index and the MSCI Emerging Markets Index of 5.3% and 3.6% respectively.
In the US, the S&P 500 Index (+6.4%) experienced its biggest one-day gain since November 21 as financial shorts were covered and “sidelined cash” was deployed, resulting in a long-absent 90% up-day .
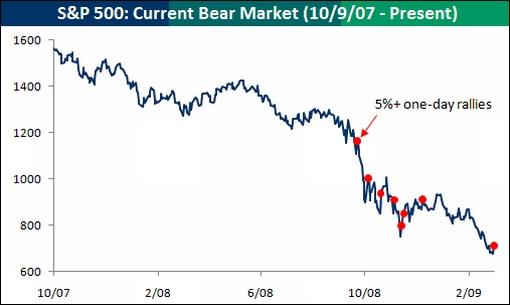
The surge in prices again raises the question: was yesterday THE bottom? Before getting too far ahead of ourselves, Bespoke highlights the fact that yesterday's gain was the eighth one-day gain of 5% or more since the S&P 500 peaked in October 2007. None of the previous occasions resulted in a sustained rally as shown by the graph below.
Given the fact that the rally occurred against a level of extremely bearish sentiment and that the oversold market has probably started exhausting itself (at least in the short term with the S&P 500 having seen only three up-days over the 16 trading days prior to yesterday), a rally may be in bloom. Should we see higher prices over the next week or so, the more important question will be whether we are dealing with anything more than an oversold bounce.
There are a few indicators I will be monitoring closely as summarized below.
(1) Prices increased yesterday on the largest volume since November 21. The up/down volume spread - determined by subtracting the volume of declining issues on the NYSE from advancing issues - needs to show sustained expansion as prices rise.
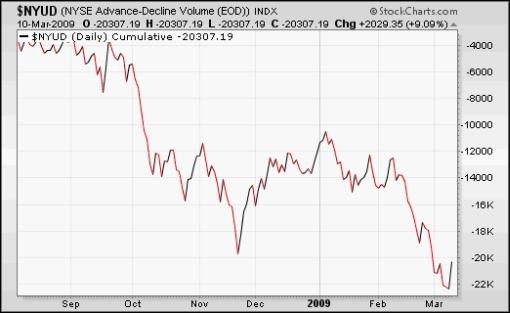
Source: StockCharts.com
(2) Similarly, the advance/decline spread , measuring the breadth of a stock market advance, needs to see advancing issues outpacing declining issues on a steady basis, i.e. a rising trend as far as the cumulative figure is concerned.
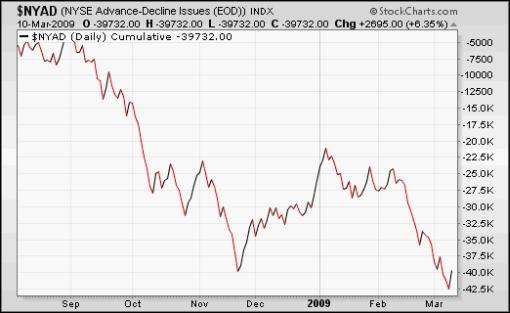
Source: StockCharts.com
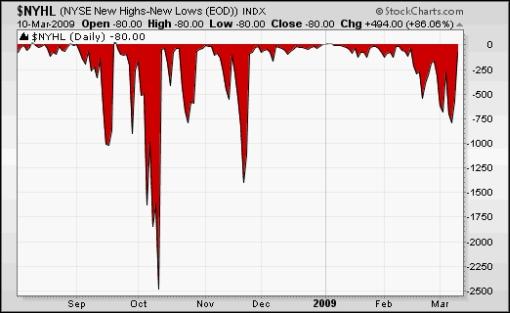
(3) New highs need to consistently outpace new lows as reflected by the net new highs , calculated by subtracting the number of new 52-week lows from the number of new 52-week highs.
(4) Turning to Lowry's Research , Richard Russell ( Dow Theory Letters ) said: “Normally, at final bear market bottoms, the Buying Power Index will plow higher as institutional money rushes in to pick up ‘bargains'.” Lowry's statistics are not yet giving any hint.
(5) The number of NYSE stocks trading above their respective 50-day moving averages is a lowly 12.0%. In order to be bullish about the secondary trend, one would expect the majority of stocks to be above the 50-day line. For a primary uptrend to manifest itself, the bulk of the index constituents also need to trade above their 200-day averages. This is a slow indicator, but the number at the moment is still only 4.5%.
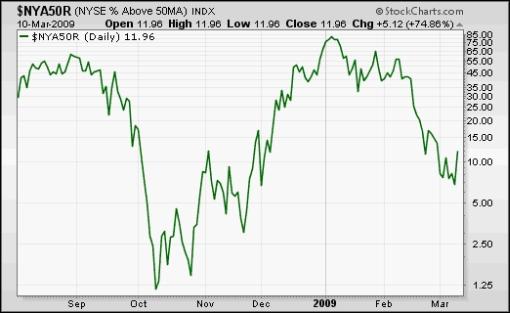
Source: StockCharts.com
(6) The Bullish Percent Index shows the percentage of stocks currently in bullish mode as a result of point-and-figure buy signals. With the figure at 13.0% for the NYSE, this indicator conveys the same message as the previous one.
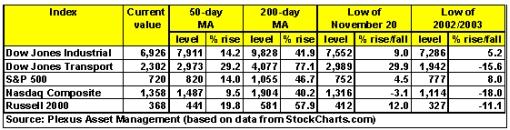
In short, the stock market still needs to do a considerable amount of work before evidence of a primary bear market low will be demonstrated. As a first step, the indices must clear their respective 50-day moving averages and the November 20 lows. (As mentioned before, the large deviations of the moving averages pointed to a massively oversold situation - almost like a spring that is stretched too far - and a measure of mean reversion was to be expected.)
It is possible that a rally may ensue and last until the release of potentially ugly earnings and guidance announcements in April. However, always remember the old adage: “bulls make money, bears make money, but trading against the primary trend makes for sleepless nights.”
Did you enjoy this post? If so, click here to subscribe to updates to Investment Postcards from Cape Town by e-mail.
By Dr Prieur du Plessis
Dr Prieur du Plessis is an investment professional with 25 years' experience in investment research and portfolio management.
More than 1200 of his articles on investment-related topics have been published in various regular newspaper, journal and Internet columns (including his blog, Investment Postcards from Cape Town : www.investmentpostcards.com ). He has also published a book, Financial Basics: Investment.
Prieur is chairman and principal shareholder of South African-based Plexus Asset Management , which he founded in 1995. The group conducts investment management, investment consulting, private equity and real estate activities in South Africa and other African countries.
Plexus is the South African partner of John Mauldin , Dallas-based author of the popular Thoughts from the Frontline newsletter, and also has an exclusive licensing agreement with California-based Research Affiliates for managing and distributing its enhanced Fundamental Index™ methodology in the Pan-African area.
Prieur is 53 years old and live with his wife, television producer and presenter Isabel Verwey, and two children in Cape Town , South Africa . His leisure activities include long-distance running, traveling, reading and motor-cycling.
Copyright © 2009 by Prieur du Plessis - All rights reserved.
Disclaimer: The above is a matter of opinion and is not intended as investment advice. Information and analysis above are derived from sources and utilizing methods believed reliable, but we cannot accept responsibility for any trading losses you may incur as a result of this analysis. Do your own due diligence.
Prieur du Plessis Archive |
© 2005-2022 http://www.MarketOracle.co.uk - The Market Oracle is a FREE Daily Financial Markets Analysis & Forecasting online publication.