Telegraph Runs with Improbable UK House Price Crash Forecast of Another 55%
Housing-Market / UK Housing Mar 12, 2009 - 02:38 AM GMTBy: Nadeem_Walayat

 The mainstream press as illustrated by The Telegraph has run with a house price forecast by Numis Securities (NS) that states that UK house prices could fall by a further whopping 55%, that is a rather incredible forecast to make in light of the of 22% fall to date. NS states that a buy to let investor panic will trigger an avalanche of further selling. I am not aware of Numis Securities past forecasts, however analysis of the perma-bear Capital Economics that has consistently been cropping up with bearish house price forecasts since at least 2002 in the mainstream media illustrated the propensity to reprint press releases with-out checking the facts as to whether the forecast is actually probable or not.
The Telegraph writes: House prices 'could fall by further 55 per cent
"People who bought buy-to-let flats are expected to “begin panic selling” and the average home value could drop below £100,000."
“Despite UK house prices already having fallen 21% from the peak, we do not believe that the correction is anywhere near over.
“Our core headline forecast is that UK property prices remain between 17% and 39% overvalued based on fair valuation. Moreover, history has shown us that when property…which has experienced a price bubble corrects, the price tends to fall below fair value for a period of time, as confidence in that market remains low. Prices could fall a further 40-55% if the over-correction was as bad as the early 1990s in our view.”
UK house prices peaked in August 2007 (UK Housing Market Crash of 2007 - 2008 and Steps to Protect Your Wealth) The rate of descent peaked for December data at -19% and has now declined to -17.7% . The rise in UK house prices during January 09 brought a brief pause to the house price crash that resumed its bear market in February into its 19th month as the below graph illustrates which is per the updated house price forecast that covers the trend into 2012 which projects for a total drop from peak to trough of 38%. However, as I have warned many times over the past 19 months, the government has in its power the ability to print money to bring nominal house price falls to standstill, this money printing is now quaintly termed as "Quantative Easing" so as to hide the truth and mask the continuing crash in house prices that despite the opinion of the mainstream press by the likes of Anatole Kaletsky and Ambrose Evans-Pritchard HAS put Britain on the path towards bankruptcy, as explained in the depth analysis of November 2008 - Bankrupt Britain Trending Towards Hyper-Inflation?, and updated more recently - Gordon Brown Bankrupting Britain as Tax Payer Liabilities Soar- Update
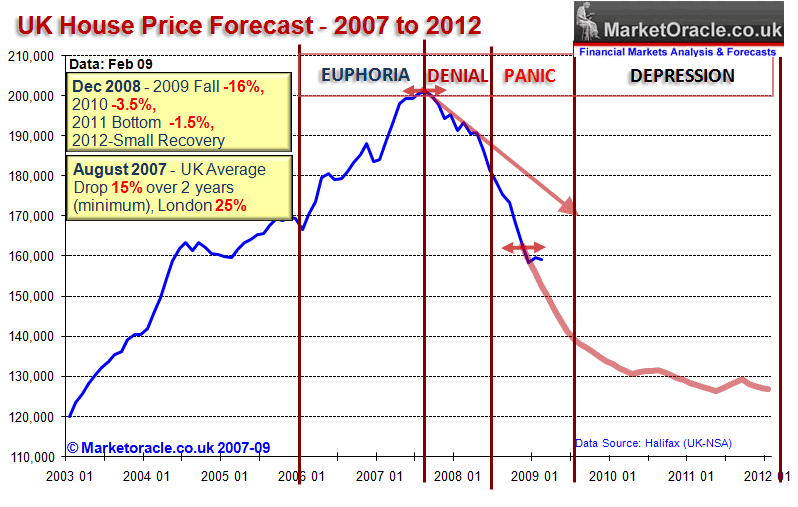
While I agree house prices are some distance away from a bottom, however UK House prices in U.S. dollars and euro terms have already crashed by more than 50%, and with sterling targeting parity to the U.S. Dollar that is another 30% shaved off of the real value of houses. What this means is that the Labour government is engaged in a policy of devaluing sterling so as to mask the crash in UK house prices which therefore means that house prices in nominal terms are less likely to fall, this is being witnessed in the house price crash chart as the rate of decline is slowing. Now if the British Pound has stayed put at £/$2.00 as a consequence of supportive monetary policy instead of the Zero Interest Rates Policy then yes we would be facing a further nominal house price fall of as much as 55%, but with the policy of quantitative inflation, the aim is to create the illusion of rising asset prices, that continue to fall in real-terms as the below graphs plainly illustrate.
The buy to let sector HAS ALREADY TRIGGERED A CRASH IN UK HOUSE PRICES, as I warned of in November 2007( Crash in UK House Prices Forecast for April 2008 As Buy to Let Investors Sell on Capital Gains Tax Change), that was forecast to begin in April 2008. To imply now, more than 18 months INTO the bear market that the buy to let sector will ACCELERATE the ongoing crash is frankly just an attempt to grab headlines, as the rate of descent is expected to slow during the year inline with the currency depreciation and return of inflation. The pertinent time to make such a forecast or observation was more than a year ago.
UK Housing Market Affordability and Interest Rates
The February rate cuts to 0.5% fulfills the forecast target for 2009 (4th Dec 08 - UK Interest Rates Forecast to Crash to 1% ), having entered Zero Interest Rates Policy, the government yesterday initiated the first stage of a £150 billion printing money run by the bank of England which further seeks to support asset prices by devaluing the value of sterling. These measures are having a positive impact on the affordability despite the recession and hence supportive of house prices.
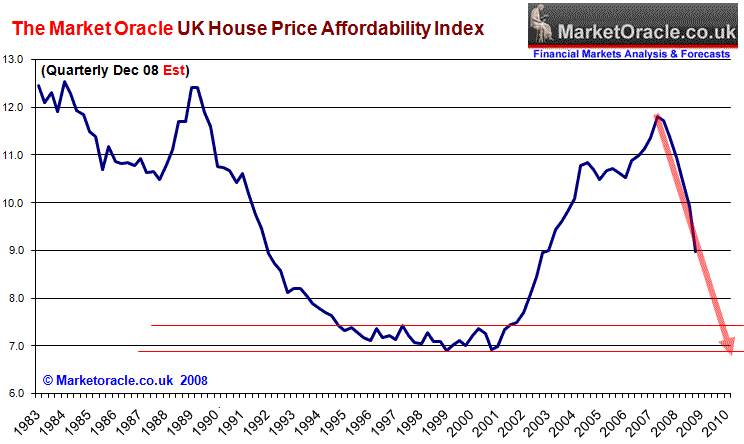
The Labour governments primary objective remains to maximise its chances of winning the next election, this will be to the detriment of future growth as the consequences of printing money and the exploding debt burden risks a currency crash that at best means many years of stagflation and at worst hyperinflationary bankruptcy along the lines of the Weimar Republic and the most recent example of Iceland. This is evidenced by the following graph of UK house prices in terms of inflation, and our key trading partner the United States (U.S. Dollar), with a similar fall observed against the Euro.
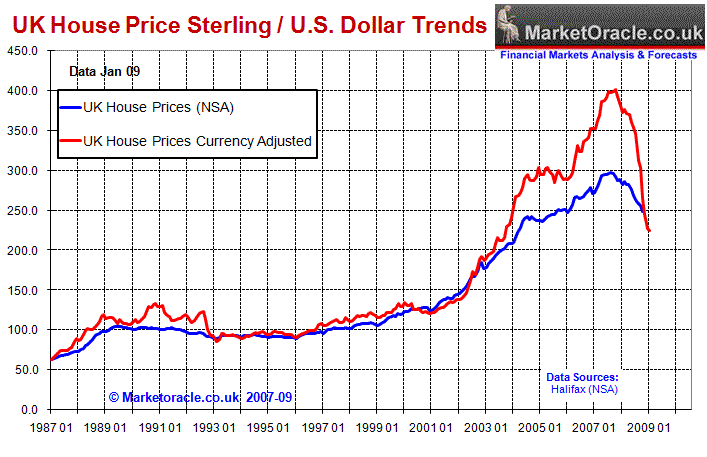
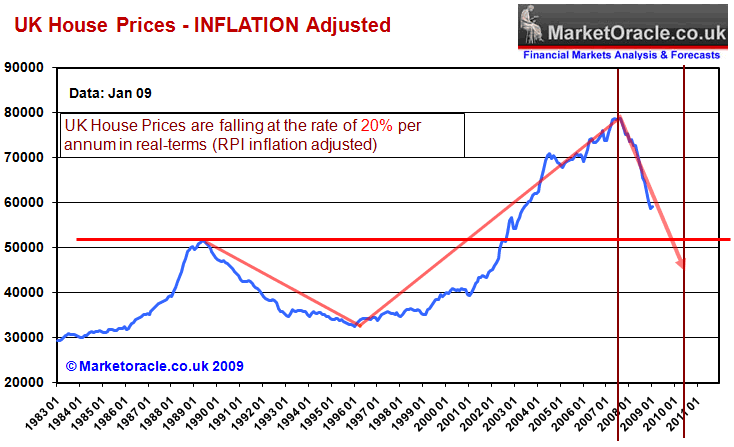
The above graphs clearly illustrate that the UK housing market has crashed by 25% (real terms) and over 40% (U.S. Dollar / Euro) which is having a severe impact on the UK economy as the real deflation of a 40% loss of value of house prices added to the more than 50% of that of stocks is tipping the UK economy towards economic depression. Therefore home buyers need to guard against the ILLUSION of stabilising house prices whilst the real terms crash in house prices continues.
UK Recession Forecast 2009-10
The following is the conclusion from the indepth analysis / forecast for the UK economy for the period 2009 to 2010 :
In the final analysis, the projected course of the recession over the next 2 years is as illustrated by the below graph in that the severe recession is expected to bottom at an annualised rate of -4.75% GDP in the fourth quarter of 2009 (small quarterly gain on the 3rd quarter), which will be followed by a recovery as the rate of annualised GDP contraction improves as government stimulus measures announced to date and deep interest rate cuts as well as future stimulus during 2009 kick into gear. The UK economic recovery is expected to continue into the fourth quarter of 2010 i.e. after the general election. The total recession from peak to trough is expected to see GDP contract by 6.3% and therefore this will be the worst recession since the 1930's Great Depression.
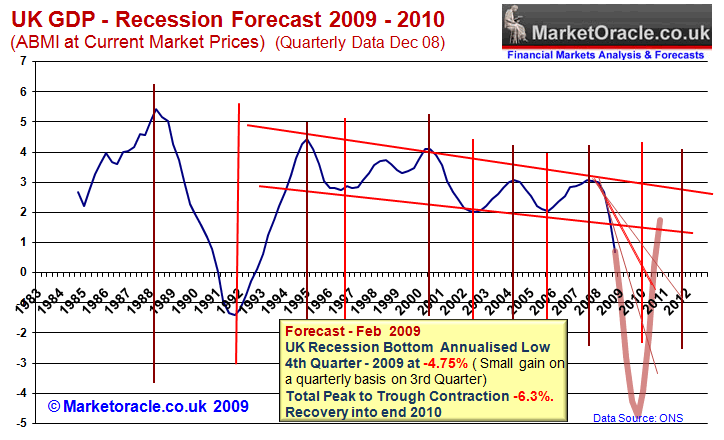
However the Labour government will do its utmost to battle against the recession especially once GDP data shows contraction of more than 4% on annual basis, therefore the expectations are strong that the Labour government will sacrifice long-term growth for the short-term possibility of turning the economy around before the 2010 election. This also suggests that the 2010 recovery may not be able to take hold and therefore sets the scene for economic weakness during 2011-2012, perhaps suggesting a double dip recession. This is supportive of the view that UK house prices after bottoming in 2010 will enter a prolonged period of stagnation due to a possible stagflationary douple dip recession.
Fighting Deflation With Inflation.
The government and the Bank of England are attempting to fight against the ongoing deflation as a consequence of the collapse of asset values, and the bankrupt financial institutions continuing to deleverage from as high as X60 of capital leveraged positions, which in the process requires the Government to step in and recapitalise the banks and take the toxic debts off the banks balance sheets.
My analysis of December 08 concluded that the UK is heading for real deflation during 2009, with the RPI inflation measure expected to go negative by mid 2009 by targeting -1.2%. The trend to date is ahead of expectations however the most recent data showed the CPI measure take a step towards trend by only registering a small drop by falling to 3% from 3.1%
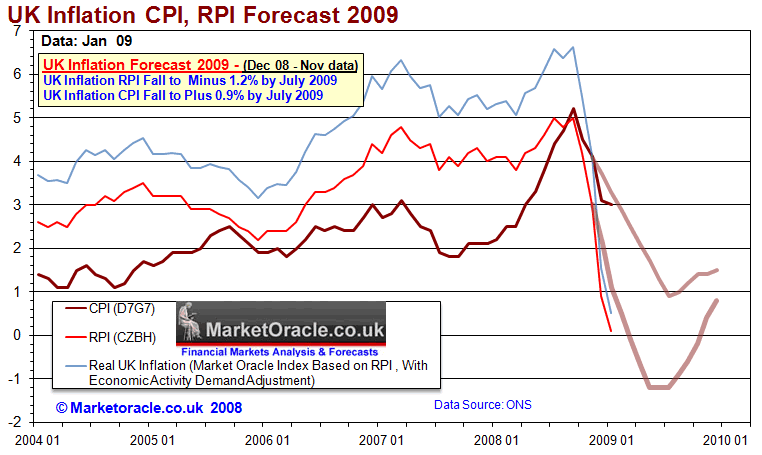
The more money the government prints and the more sterling falls then the greater will be the bounce in inflation during the second half of 2009, i.e. greater than that which was originally forecast (as illustrated above) this will become much clearer by the middle of 2009, but is suggesting that investors need to increasingly gear themselves up towards much higher forward inflation. As I pointed out in the December analysis - The fall in sterling will result in much higher high street consumer prices during 2009 as those retailers that have not gone bust seek to replenish stocks at much higher prices during 2009. This again suggests that the January Sales for Britons may prove to be more illusionary than real as the fall in sterling has already soaked up corporate margins, which again confirms that those UK shoppers seeking to make large purchases are probably better off to do so sooner rather than later. This therefore sends out mixed signals for consumer prices later in 2009.
This is now starting to be reflected in food prices as produce is being exported abroad and therefore resulting in less domestic supply, which will soon also be reflected in other goods and services as the price of imports soars and therefore confirms the view of much higher inflation during the second half of 2009.
Therefore the best outcome at this point from the credit crisis would be for a period of stagflation i.e. low economic growth with high inflation and interest rates. The high inflation will be a necessary evil so as to devalue the value of the record amounts of debt that the government is ratcheting up as illustrated below. The worst case scenario is that of hyperinflation and a collapse of the British currency / economy along the lines of where Iceland is today which has seen a collapse of some 30% in its annual GDP, again both of these scenerios imply support for nominal house prices.
UK Debt Liabilities
Britain's growing liabilities as a consequence of bailing out of the bankrupt banks that already project to 300% of GDP as the below graph illustrates as per the recent analysis - Gordon Brown Bankrupting Britain as Tax Payer Liabilities Soar- Update.
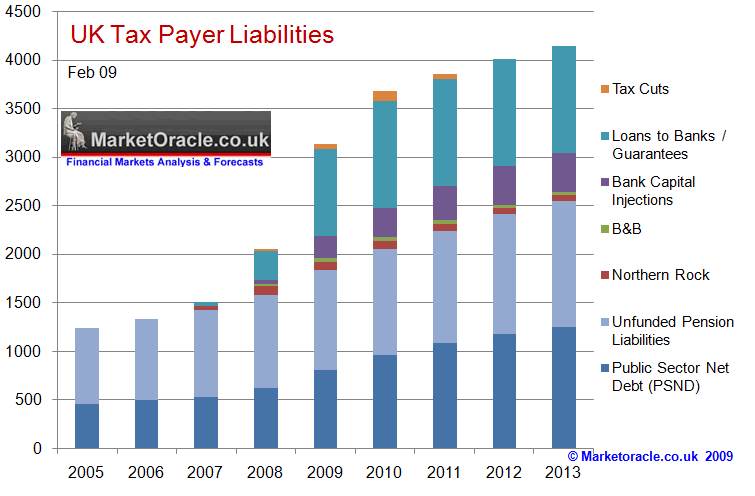
Attempting to save the bankrupt banks has already saddled the tax payer with £1.2 trillion of liabilities and is expected to pass above £2 trillion by the end of 2009. The eventual amount of liabilities may extend to as high as £5 trillion if the whole banking system's liabilities were dumped onto the British tax payer which would trigger far more Quantative Easing as the government instructs the Bank of England to print money to buy government debt due to the increasingly skeptical financial markets which would send the currency spiraling lower and inflation spiraling higher.
Therefore nominal house prices will be increasingly supported by the highly inflationary measures being put into action whilst real terms values continue to erode. This therefore increasingly points to a gradual decline in the rate of house price falls, and suggests a prolonged period of stagnation. However, it does make the Numis Securities forecast for a possible another 55% fall in UK house prices EXTREMELY unlikely, if anything the UK housing market is targeting a shallower rate of decline in the order of another 14%-16% over the next 2 years rather than the Telegraphs scare mongering headline grabbing 55%, and if inflation is worse then expected then the pace of house price falls may still reduce further.
By Nadeem Walayat
http://www.marketoracle.co.uk
Copyright © 2005-09 Marketoracle.co.uk (Market Oracle Ltd). All rights reserved.
Nadeem Walayat has over 20 years experience of trading derivatives, portfolio management and analysing the financial markets, including one of few who both anticipated and Beat the 1987 Crash. Nadeem's forward looking analysis specialises on the housing market and interest rates. Nadeem is the Editor of The Market Oracle, a FREE Daily Financial Markets Analysis & Forecasting online publication. We present in-depth analysis from over 250 experienced analysts on a range of views of the probable direction of the financial markets. Thus enabling our readers to arrive at an informed opinion on future market direction. http://www.marketoracle.co.uk
Disclaimer: The above is a matter of opinion provided for general information purposes only and is not intended as investment advice. Information and analysis above are derived from sources and utilising methods believed to be reliable, but we cannot accept responsibility for any trading losses you may incur as a result of this analysis. Individuals should consult with their personal financial advisors before engaging in any trading activities.
Attention Editors and Publishers! - You have permission to republish THIS article. Republished articles must include attribution to the author and links back to the http://www.marketoracle.co.uk . Please send an email to republish@marketoracle.co.uk, to include a link to the published article.
Nadeem Walayat Archive |
© 2005-2022 http://www.MarketOracle.co.uk - The Market Oracle is a FREE Daily Financial Markets Analysis & Forecasting online publication.


