


Commodities Close to Long-term Buy Signals, Gold, Silver, Oil and Natural Gas
Commodities / Commodities Trading Aug 06, 2009 - 01:28 AM GMTBy: Chris_Vermeulen

 This week commodities have been moving higher which is exciting. Gold, silver, oil and natural gas all have bullish looking daily and intraday price action. Monday we saw commodities spike higher and profit taking Tuesday and Wednesday. I am expecting a sharp move here and it could be in either direction, so this report is to keep you on your toes.
Gold & Silver Sector
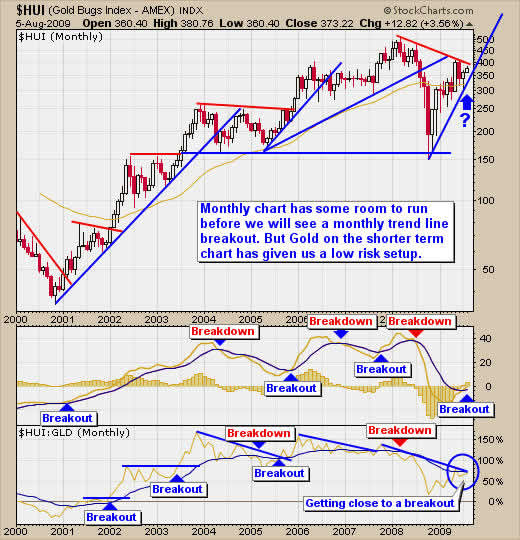
Below is the monthly chart of the HUI index (gold stocks). With the recent move in precious metals we are seeing gold stocks surge higher. The monthly chart generates long term buy signals. We are looking for a breakout above the red resistance trend line and if we get a breakout then I expect prices to surge higher for gold stocks, gold and silver bullion.
Gold Miners Index – GDX ETF – Daily Chart
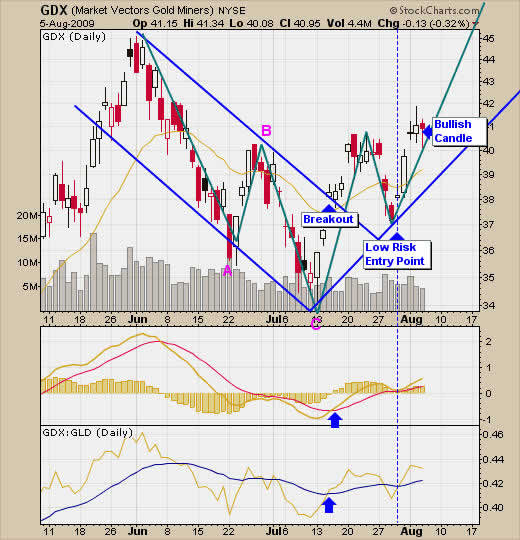
Here is a chart of the gold miners exchange traded fund. This chart generated a low risk buy signal for us last week and looks to be setting up for another move higher. The reason I think we will see prices move higher tomorrow is because the intraday price action was bullish for both gold stocks and gold bullion. The red candle shows a long lower wick. This shows prices sold down and buyers stepped in buying up gold stocks. If we get a rally this week and make a new multi week high then we are able to draw a new support trend line. We will use this level as our stop (exit point) if price breaks below.
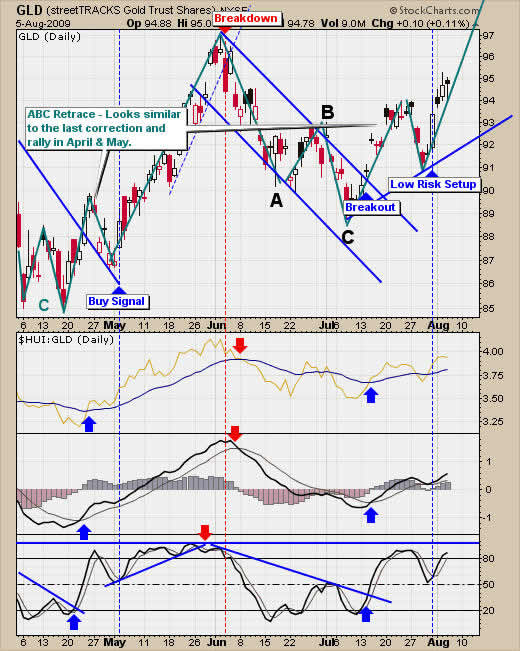
Gold Bullion Fund – GLD ETF – Daily Chart
Gold has similar price action and we hope to see higher prices.
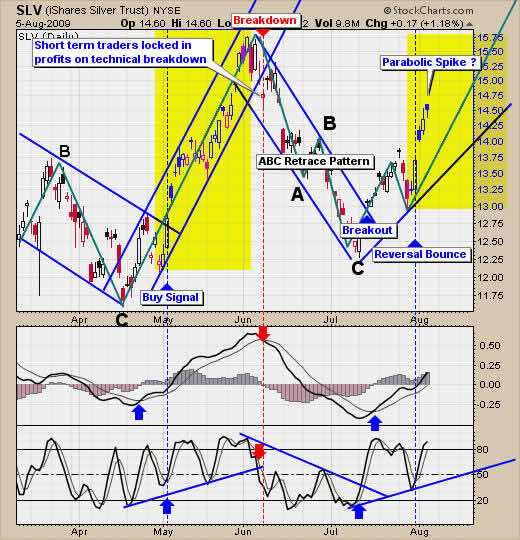
Silver Bullion – SLV ETF – Daily Chart
While gold and gold stocks have been moving sideways for two days silver continues to rally. Silver can act as a leading indicator for gold so it is exciting to see prices rise.
The Energy Sector
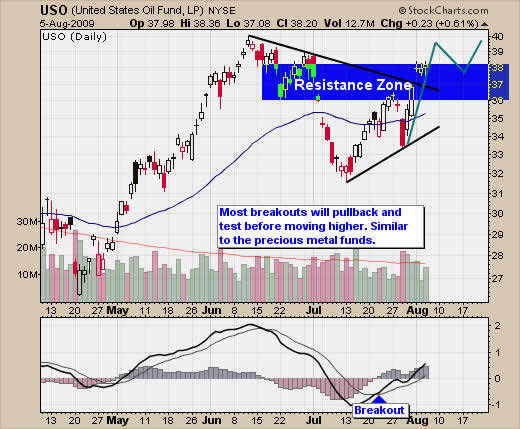
Crude Oil – USO ETF – Daily Chart
Crude oil; broke out above our resistance trend line this week and has been moving sideways since Monday. This fund could pop up or down quickly here. I do not think it’s a good idea to be chasing it here.
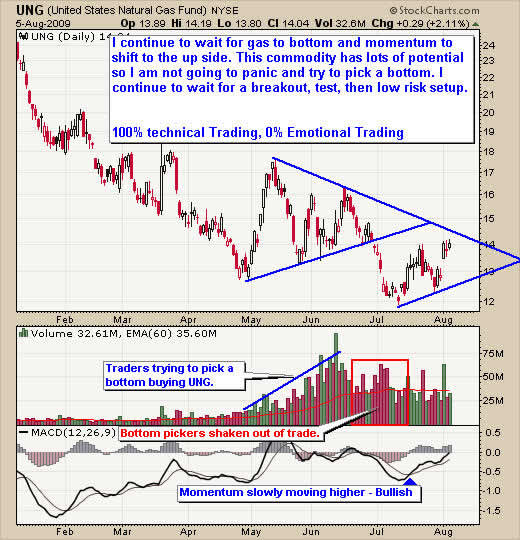
Natural Gas – UNG ETF – Daily Chart
Seems like everyone wants to trade natural gas. I actually think more people are watching it than gold. Which is understandable because I too think Nat Gas has huge potential in the mid – long term time frame. This commodity/fund has chewed up more traders than any other fund. Maybe USO sucked as many people in; either way people are losing their shirts or already lost them with UNG!
It’s amazing how well some traders can buy at the high and sell almost at the very bottom when trading on emotions (fear and greed). That’s exactly what happens to traders when they see something with so much potential. Traders are thinking price could spike 50- 75% so they buy UNG because they are scared to miss out on the rally. Then greed sets in, they either buy more than they should have (large portion of their portfolio) or they buy more when the price drops a little. Eventually when prices break down and start to free fall all the weak hands bail out of their positions taking a nasty loss.
All this started because they think natural gas has HUGE potential and did not want to miss out. I do like natural gas but until I get a setup I keep my powder dry. If there is half the potential everyone is talking about then why is everyone so persistent at trying to pick the exact bottom? I do not bottom pick in a bear market, it’s not what successful traders do. Wait for the momentum to shift and jump on board when risk is low. I just want the low risk middle section between the bottom and the top.
TheGoldAndOilGuy Trading Conclusion:
The monthly hui chart is getting close to a long term buy signal. With any luck our recent buy signal in GDX will have us in early for the big breakout and multi month rally. I do not forecast but technically speaking the charts are looking bullish for precious metals. It is time for commodities to shine as they pause to take a breather. We could get a sharp drop or a nice pop higher in the next couple days only time will tell so be ready to lock in some gains if things start to slide.
The energy sector had some nice price action this week and with any luck we will have a low risk buy signals for our funds in the coming weeks.
Hello, I'm Chris Vermeulen founder of TheGoldAndOilGuy and NOW is YOUR Opportunity to start trading GOLD, SILVER & OIL for BIG PROFITS. Let me help you get started.
If you would like more information on my trading model or to receive my Free Weekly Trading Reports - Click Here
If you have any questions please feel free to send me an email. My passion is to help others and for us all to make money together with little down side risk.
To Your Financial Success,
By Chris Vermeulen
Chris@TheGoldAndOilGuy.com
Please visit my website for more information. http://www.TheGoldAndOilGuy.com
Chris Vermeulen is Founder of the popular trading site TheGoldAndOilGuy.com. There he shares his highly successful, low-risk trading method. For 6 years Chris has been a leader in teaching others to skillfully trade in gold, oil, and silver in both bull and bear markets. Subscribers to his service depend on Chris' uniquely consistent investment opportunities that carry exceptionally low risk and high return.
This article is intended solely for information purposes. The opinions are those of the author only. Please conduct further research and consult your financial advisor before making any investment/trading decision. No responsibility can be accepted for losses that may result as a consequence of trading on the basis of this analysis.
Chris Vermeulen Archive |
© 2005-2022 http://www.MarketOracle.co.uk - The Market Oracle is a FREE Daily Financial Markets Analysis & Forecasting online publication.