


Gold Short-term Trend Flattening Out
Commodities / Gold & Silver 2009 Sep 06, 2009 - 04:58 PM GMTBy: Merv_Burak

 The week started slow, ended slow but the middle was a blast. With a long week-end ahead one is brave to try and predict what the next trading day will bring. So, the best we can do is to determine where we are.
GOLD - LONG TERM
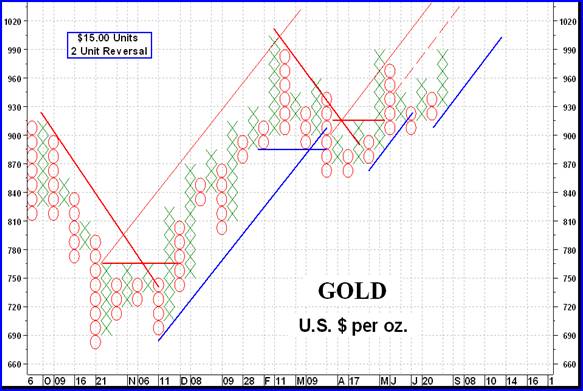
On THIS long term point and figure chart gold made its last upside break in Mid-May and hasn’t come close to a bearish reversal since. This past week’s action, looking from a long term perspective, is just a continuation of this bullish trend. One must not overlook the fact that the price is at a resistance level right now and there is still that other one at $1005 from the February top. Neither resistance looks all that strong but we should never assume the future. Understand the present, go with it, watch should the trend reverse, and go with THAT. Predicting the future and blindly placing your bets on it happening is for Las Vegas gamblers. Placing your bet with the trend in motion and watching it and getting out when it reverses is for the securities speculator. “Investors”, in my view, come under the Las Vegas gambling definition.
I am not into chat rooms or any of these social networking sites. Most of these wonderful inventions just go over my head. However I understand that there is/are comments on some of these sites about my commentaries. Apparently one such comment was about my point and figure charts and that the trend lines I draw are not the 45 degree variety but arbitrary lines through market tops or bottoms. This reflects some lack of understanding about charts and trend lines. Unless mentioned otherwise, ALL of my point and figure trend lines are of the “45 degree” variety. They may not look it at times but they are all under the 45 degree definition.
45 degree trend lines are drawn at a slope equal to one space to the right and one space up (or down). Where the chart units are perfect squares, i.e. the height and width of each unit is exactly the same length, then we have a true 45 degree angle trend line. Where the unit is not a perfect square, i.e. the height and width are different lengths, then although we still draw the trend line with a slope one unit to the right and one unit up (or down) the angle will be something other than a true 45 degrees, BUT it is still a “45 degree” trend line since it conforms to the definition one unit to the right and one unit up (or down).
The reason for unequal units is most often just to more effectively cover most of the chart page. Changing the size of the units or the number of unit reversals for a direction change may often do the same trick but then the chart itself changes and one may prefer slightly skewed unit size than a change in the chart itself.
The week’s action has broken above the megaphone pattern and now we await the results to see how strong the break was. As mentioned in previous commentaries, the action inside the megaphone was progressing into the zone where the strength of any break starts to weaken.
As one can expect, the price of gold is well above its positive sloping moving average line and the long term momentum indicator is zooming right along moving upwards inside its positive zone and above its positive trigger line. Although the daily volume action has not been all that impressive lately the cumulative effect has been. The volume indicator continues to move higher in new high territory and above its positive trigger line. The long term rating therefore remains BULLISH.
INTERMEDIATE TERM
With the gold action at mid-week one can only come to one conclusion as to where the intermediate term rating could be. With the price of gold above a positive moving average line and the momentum in its positive zone above a positive trigger line everything looks rosy. The volume indicator continues to move higher above its positive trigger line. The rating can only be BULLISH at this time.
SHORT TERM
From the short term standpoint the chart sure looks good. The only problem with the chart is that it might look too good. Both the short term momentum indicator and the more aggressive Stochastic Oscillator are in their overbought zones. Neither has yet turned around and moved below its overbought line. Once that happens we can then expect a short reaction. Whether it would generate into something more than a short term reaction we would have to wait and see.
Shown last week on the chart was a short term version of my FAN PRINCIPLE trend lines with a confirmation of a short term bull move in progress. Using short term indicators and/or charts one should not immediately expect that confirmed moves will last for a considerable period of time. They just might but with short term indicators all they are suggesting is a short term move. We had that this week. Any further upside is just additional gravy.
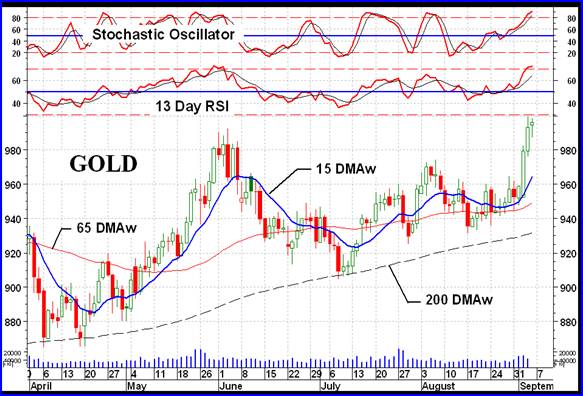
As we can see, the price of gold has shot up way above its short term positive sloping moving average line. The momentum indicator has moved into its overbought zone above its positive trigger line. The daily volume action could be a lot better but maybe the long weekend coming up had some influence. In the end, the short term rating remains BULLISH.
As for the immediate direction of least resistance, after a week like the one we had I would think that it was time for a rest so I will go with the lateral trend. Friday’s action almost looked like it couldn’t gain anymore real height and the momentum indicator does look like it is in the process of flattening out.
SILVER
Silver seems to be the precious metal of the day. With a weekly advance more than double that of gold silver has once more taken the number one spot in the short term Relative Strength ratings of all the Indices in the Precious Metals Table (see below). The average silver stock out paced the average gold stock by 2 to 3 percentage points. Will it last? Stay tuned.
Unlike gold which did have a losing day on Monday silver has been in a steady climb since the previous Friday. The price is above all of its moving average lines and they are all in positive trends. The same for the momentum indicators, all positive and above their positive trigger lines. Although the daily volume activity was reasonable it was not especially high. Still, the volume indicator, a cumulative indicator of volume action, is into new all time highs suggesting speculators continue to favor silver as a speculation. The ratings for all three time periods remain BULLISH.
PRECIOUS METAL STOCKS
Well, you couldn’t ask for a much better week than this past one. Most of the major Indices were in double digit territory with the silver Indices showing the best results and the Penny Arcade Index showing the least gain. I have been mentioning that as long as the Penny Arcade Index has not topped out and in a bearish trend then any weakness in the overall markets would be short lived. That does not mean that the “penny” stocks should be in the forefront of each and every advance. There will be times, like last week, when the average penny stock will not perform as well as the higher quality stocks. Once the advance in stocks has had a time for speculators to gain greater confidence in the up trend THEN you should see the pennies really move again. Despite the lower penny gain there were still 11 stocks out of the 30 penny components that had double digit gains on the week, one with a gain of 46%. So, some are moving but on the average the pennies under performed this past week.
For the universe in general, we had 147 stocks on the up tick during the week for a 91.9% positive trend while only 9 stocks closed on a down tick for 5.6% bummer. I don’t recall such a huge imbalance between the winners and losers in a very long time. I also would not expect a similar performance again for another long time. Good weeks may continue but I doubt if they will do so with such a lob sided performance.
MERV’S PRECIOUS METALS INDICES TABLE
Well, that’s it for another week.
By Merv Burak, CMT
Hudson Aero/Systems Inc.
Technical Information Group
for Merv's Precious Metals Central
For DAILY Uranium stock commentary and WEEKLY Uranium market update check out my new Technically Uranium with Merv blog at http://techuranium.blogspot.com .
During the day Merv practices his engineering profession as a Consulting Aerospace Engineer. Once the sun goes down and night descends upon the earth Merv dons his other hat as a Chartered Market Technician ( CMT ) and tries to decipher what's going on in the securities markets. As an underground surveyor in the gold mines of Canada 's Northwest Territories in his youth, Merv has a soft spot for the gold industry and has developed several Gold Indices reflecting different aspects of the industry. As a basically lazy individual Merv's driving focus is to KEEP IT SIMPLE .
To find out more about Merv's various Gold Indices and component stocks, please visit http://preciousmetalscentral.com . There you will find samples of the Indices and their component stocks plus other publications of interest to gold investors.
Before you invest, Always check your market timing with a Qualified Professional Market Technician
Merv Burak Archive |
© 2005-2022 http://www.MarketOracle.co.uk - The Market Oracle is a FREE Daily Financial Markets Analysis & Forecasting online publication.