


Commodity Report for Gold, Silver, Crude Oil and Natural Gas
Commodities / Commodities Trading Nov 09, 2009 - 12:50 AM GMTBy: Chris_Vermeulen

 Everyone is talking about commodities as the place to be in the coming months. I tend to agree, but it is still important to know where each commodity is trading to maximize returns and reduce risk.
That being said we are also seeing money flow out of the small cap stocks and into the large cap blue chips Stocks. These companies prove year after year that they are profitable and that’s where investors have been putting their money the past couple weeks. This can be seen by simply looking at the Dow Jones Industrial Average and the Russell 2000 index as the Russell has dropped in value much more than the Dow. But if we see the market turn back up and make a new yearly high in the coming weeks, small cap stocks will most likely provide explosive opportunities for traders.
Below is some analysis on gold, silver, natural gas and oil
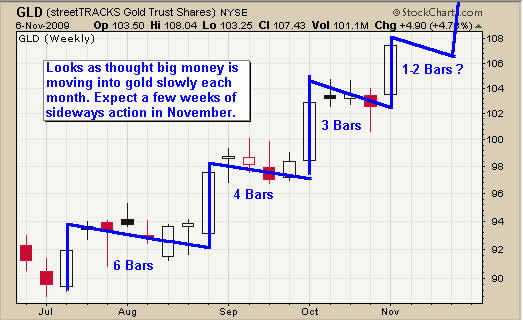
GLD ETF Trading – Weekly Trading Chart
By looking at the weekly chart of gold we can see two simple things.
1 – Each breakout is happening quicker as money continues to move into gold.
2 – This step like pattern (bull flags) is very powerful and can continue for a very long time.
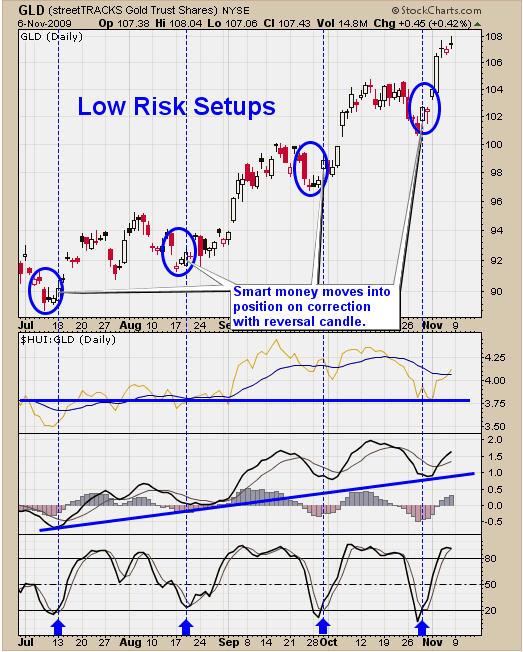
GLD ETF Trading – Daily Trading Chart
This chart shows the same price action but on a daily chart. It also shows one way to find and trade low risk setups for the GLD ETF traded fund.
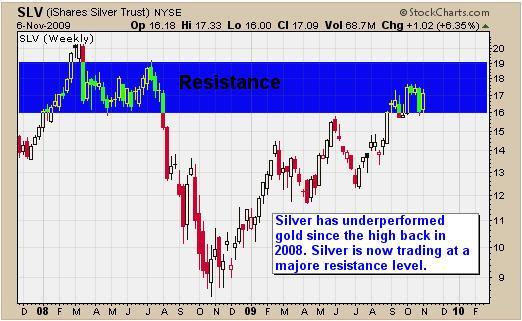
SLV ETF Trading – Weekly Trading Chart
Silver ETF trading has not been as exciting. Silver has yet to breakout above the 2008 high. It is actually trading at a major resistance level and still has some work to be done before looking really bullish in my eyes. This is acting like major resistance level for two main reasons.
1 – It is testing the 2008 highs where a lot of traders bought silver over a 5-6 month period. There are a lot of sellers to flush out before moving higher.
2 – The drop in silver price in late 2008 was so scary for investors who bought at $16-20 that they cannot believe they are getting their money back. I think this is making a higher volume of investors sell their positions at break even because they just want out after seeing 50% loss at one point last year.
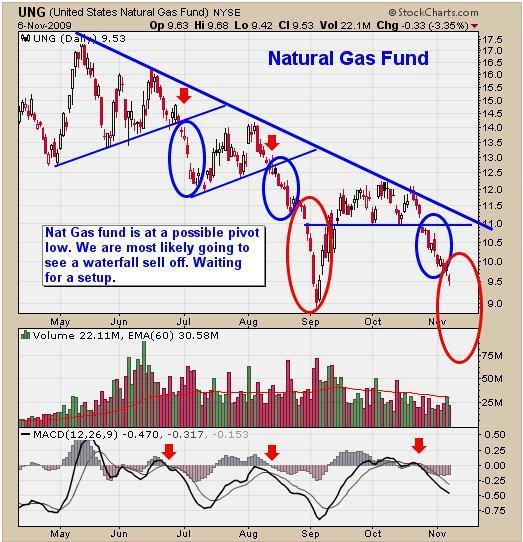
UNG Fund Trading – Daily Trading Chart
UNG has been sliding lower and lower since hitting its head on resistance back in October. The gap down on Friday is bearish indicating traders are starting to panic out of UNG and willing to get out at any price.
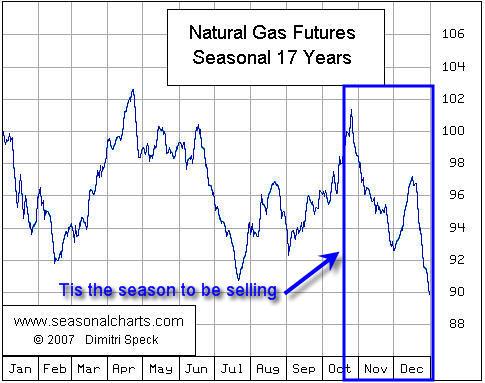
UNG Fund Trading – Natural Gas Seasonality Timing
UNG and the seasonality chart seem to be spot on for timing the price of natural gas. Keeping an eye on seasonality and general market seasonal patterns can really help improve ones performance. It may be better to trade stocks or commodities, or maybe just carry more cash depending on the timing and situation the market is in.
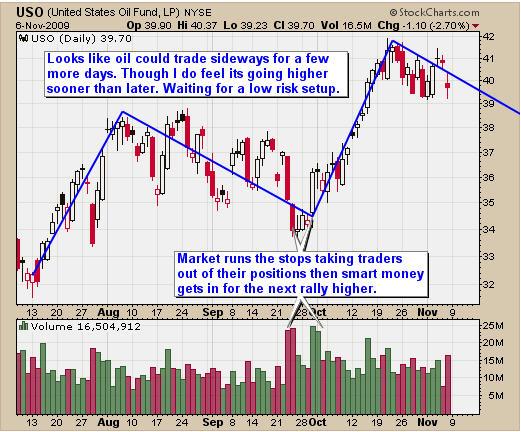
USO Fund Trading – Daily Trading Chart
USO has broken out from its large multi month consolidation from August – early October and is now forming a bull flag. While this flag could last a couple months I have feeling we will see a breakdown or a breakout sooner than later. This is just a gut feel and I will continue to watch and wait for a low risk setup.
Commodity Trading Newsletter Conclusion:
To sum up next weeks market action I feel it will not be anything to write home about. Gold and silver will most likely trade sideways or up, natural gas should continue lower and crude oil should trade sideways. With any luck stocks will continue to rally and test the highs once again.
GLD ETF continues to be our investment of choice as it provides the more accurate low risk setups time and time again. With any luck we could get some low risk setups this week but I am not counting on it.
Join my free gold trading newsletter
If you would like to receive my Free Weekly Trading Reports like this please visit my website: www.TheGoldAndOilGuy.com
To Your Financial Success,
By Chris Vermeulen
Chris@TheGoldAndOilGuy.com
Please visit my website for more information. http://www.TheGoldAndOilGuy.com
Chris Vermeulen is Founder of the popular trading site TheGoldAndOilGuy.com. There he shares his highly successful, low-risk trading method. For 6 years Chris has been a leader in teaching others to skillfully trade in gold, oil, and silver in both bull and bear markets. Subscribers to his service depend on Chris' uniquely consistent investment opportunities that carry exceptionally low risk and high return.
This article is intended solely for information purposes. The opinions are those of the author only. Please conduct further research and consult your financial advisor before making any investment/trading decision. No responsibility can be accepted for losses that may result as a consequence of trading on the basis of this analysis.
Chris Vermeulen Archive |
© 2005-2022 http://www.MarketOracle.co.uk - The Market Oracle is a FREE Daily Financial Markets Analysis & Forecasting online publication.