


Stock Market Breakdown!
Stock-Markets / Stock Markets 2010 Jan 25, 2010 - 05:07 PM GMTBy: Brian_Bloom

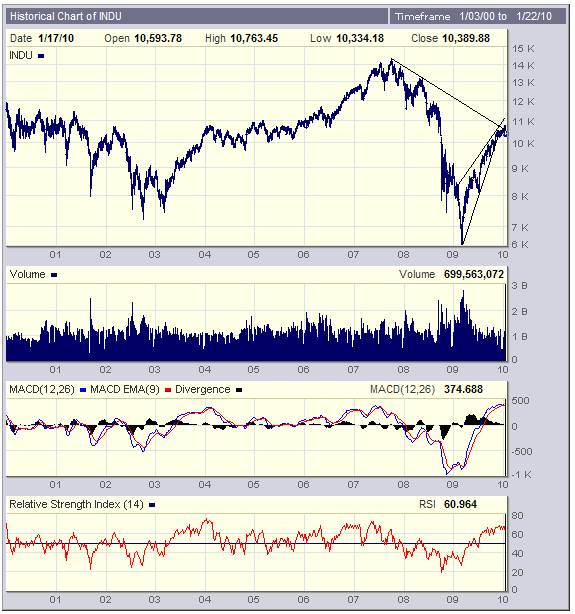
 The monthly chart of the Dow Jones Industrial Index below (courtesy BigCharts.com) shows that the Index:
1. has failed to penetrate the falling trend line on the upside, and
2. has broken below the lower boundary of the (typically bearish) rising wedge pattern
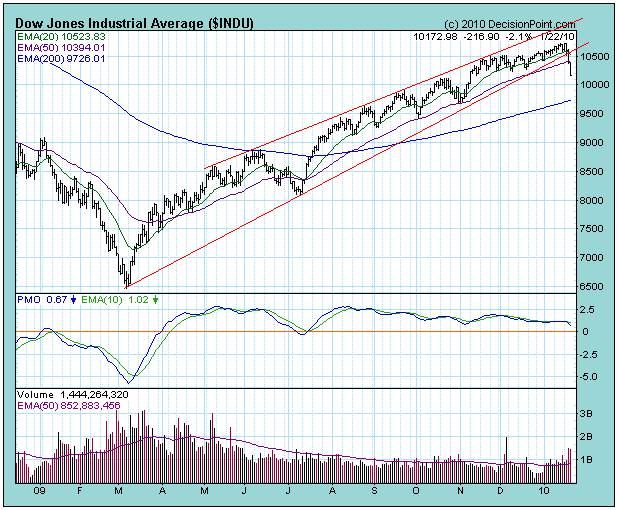
Importantly, it can be seen on the daily chart below (courtesy DecisionPoint.com) that this breakdown occurred on rising volume, i.e. it was accompanied by selling pressure.
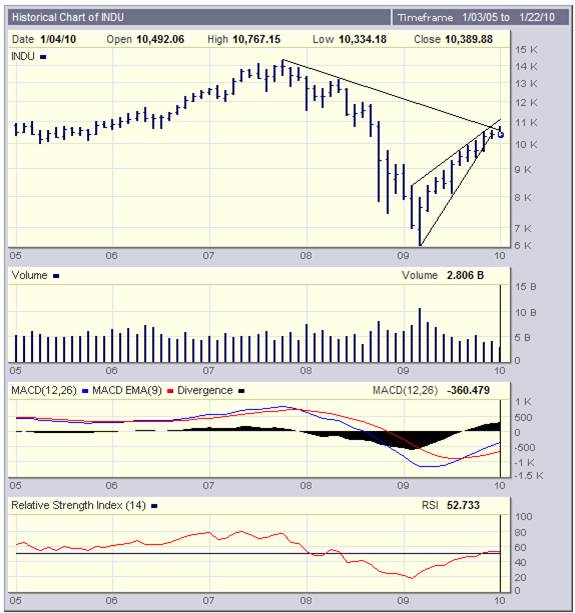
Perhaps more importantly, the weekly chart below shows that the MACD oscillator has turned down from an historically overbought position and – if the Dow does not rise strongly from this point – will likely give another intermediate sell signal in the very near future.
In the past decade this rolling over of the MACD from such an overbought level has occurred only three times.
- Following the first time – in 2004 – the Dow travelled sideways for 2 years before breaking up above the 11,000 level.
- The second time – in mid 2007 – was followed by a serious decline from 14,000 to around 6,000
- We are now witnessing “strike three”
In the past few weeks this analyst has been contemplating his navel by re-reading several of the articles he posted over the past few months. At times his prognoses sounded exceptionally pessimistic and sometime they even sounded off-the-wall; so much so that some regular web based publishers chose not publish some of his seemingly more outlandish forecasts. In hindsight, the calls were based on reasoned logic and have mostly emerged as expected. However, we need to look forward, not backwards. Given that the forecast breakdown is now manifesting, the last unanswered questions are:
1.How far will the US markets fall?
2. What will be the impact on the world economy in general?
To answer these questions we need to turn to a mixture of fundamentals and technicals – but the short answer is that the equity markets may very well fall by between 40% and 50%.
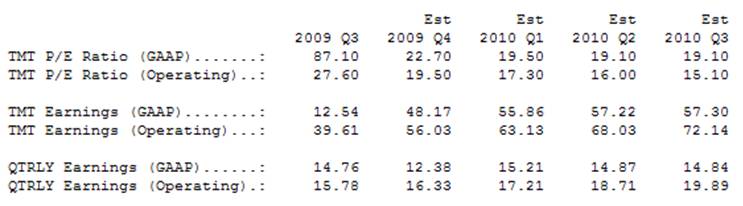
Below is a forecast by Standard and Poor of the next three quarters’ twelve month trailing earnings adjusted for Generally Accepted Accounting Principles (GAAP) (Courtesy DecisionPoint.Com) and the implied P/E ratios that flow from these earnings, assuming the index remains at its current level. The forecast GAAP P/E ratio is 19.10X based on anticipated TMT earnings of an average of $57.30 per share in Q3 of 2010. (Readers are advised to ignore “operating” earnings which are typically a figment of the imagination of bonus driven management teams)
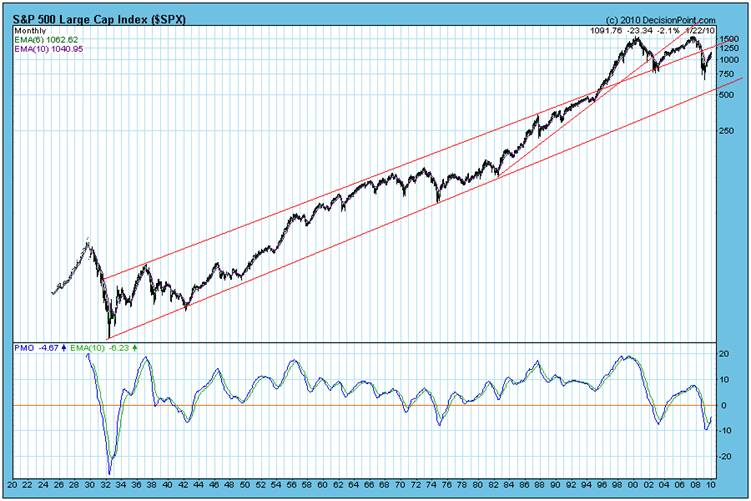
The long term chart below (also courtesy DecisionPoint.com) shows that P/E ratios of around 20X (the red line) have typically prevailed in overvalued markets.
If perceptions of growth of the US economy change to become pessimistic – and assuming the forecast GAAP adjusted 12 months trailing earnings of $57.30 actually materialize – then the Standard and Poor 500 Index may fall to an “undervalued” level of 573 (10 X $57.30) from its Friday close of 1,091; a fall of around 47%.
If we now look at the long term chart below – of the $SPX dating back to the 1920s – we can see that such a level will encounter support approximately at the level of the rising trend line that commenced in 1932 and could be drawn in 1943 by joining the rising bottoms.
Speaking of 1932, a friend sent me a copy of the two charts below – which can be found at http://www.elliottwave.com/single-issues/ff/1001FF_Tale_of_Two_Charts_With_One_Message.aspx?code=cg
One of these charts depicts the 1929 – 1930 period and the other depicts the 2008 – 2010 period. The similarities are uncanny!
Why is this happening? Surely we are smart enough to have learned from our previous mistakes? Surely humanity has the capacity to exercise free will and choice?
The answer to these questions lies in the fact that humanity (and all of humanity’s social organization structures including the economy) is a subset of Nature and Nature has a heartbeat. Like the long distance runner we can pace ourselves or we can exhaust ourselves quickly – but that is all we can do. Ultimately we cannot change the fact that if we want our collective economic heart to continue beating we have to allow our economic system to breathe both in and out. If we arrogantly assume that we have the power to over-ride the forces of Nature then we will find ourselves overwhelmed by these forces.
From the perspective of the economy, what are the forces of Nature at work?
The chart below – the one with the solid lines – is a forecast of energy production using a set of equations known as the Volterra Lottke equations. The chart appeared in the May 1985 edition of the New Scientist Magazine.
Importantly, the Volterra Lottke equations were first developed in the 1920s to model the behaviour of populations of buck and wolves in the forests of Europe. In brief, it was found that the wolves fed on the buck population until the buck population became so depleted that it could no longer support the growing wolf population. Then, as the wolf population died out, the buck population was given the opportunity to regenerate and the cycle was repeated.
The author of the article which contained the above chart (Dr. Cesare Marchetti) pictured various energy inputs as species competing for space in the market place and he applied the Volterra Lottke equations to model the energy life cycles. When he compared the actual energy inputs (the squiggly lines) with the forecast inputs (solid lines) he found an astonishingly tight fit. Arguably, he proved (perhaps unwittingly) that the economy is a subset of Nature and that our planet, overall, behaves as if it was an integrated biological system.
Interestingly, he also discovered a correlation between energy inputs and patent registrations – as can be seen from the chart below:
Finally, he found that the “heartbeat” of the world economy pulsed with the regularity of a clock, as can be seen from the chart below:
But our politicians and bankers got it into their heads that they could over-ride this pulse. Instead of allowing the economy to breathe out and make way for new energy paradigms when the world had passed Peak Oil (which is what would have automatically happened had the US and Australia ratified the Kyoto Protocols in 1998) they sought to tamper with the economy in order to prolong the life expectancy of the cash rich legacy industries which had vested interests to protect and which were providing funding to ensure a maintenance of the status quo. Here’s a broad brush picture of what happened next.
- Driven by this social pressure at decision maker level, the central bankers of the world (led by “Sir” Alan Greenspan and later by Ben Bernanke) pumped money and credit into the economic system. This did not stimulate the economy so much as it caused asset bubbles to emerge and it made ordinary investors believe that they were extraordinarily clever. Debt levels rose in tandem with rising real estate levels as people leveraged their assets to invest in a ‘sure thing”. People generally felt richer. But when real estate values fell and debt levels remained high the first cracks began to show. The Whizz Kids of Wall Street were wheeled in and they prescribed the hair of the dog.
- Debt levels rose further. Real Estate prices did not rise to previous levels. Oops.
- In historical context of consumer spending having accounted for up to 70% of US GDP, true unemployment in the USA rose above 17%. Consumption by the unemployed fell. Savings of the employed rose. Consumer spending fell overall. Oops again.
- Personal debt levels began to fall as debts were either repaid or written off.
- The US government believed that it needed to replace consumer spending with government spending. The US Government got deeper into debt. This began to worry its creditors. China in particular, the US’s largest creditor, began to tighten its lending belt. Oops again. (Fortunately, it did this in a way that was fairly diplomatic; announcing that it wanted to curb its own overheated economy which, when you dig down deep enough, you find was largely driven by infrastructure and real estate activity.)
Investors “rationalized” that the centre of gravity of the world economy was shifting to the East. This rationalization was pure fantasy. Yes, the centre of gravity is shifting towards the east. But the reality can be seen in the table below. The economies of the so-called BRIC countries (the high growth countries of Brazil, Russia, India and China) together barely add up to half the combined size of the USA and EEU economies – both of which are in recession. In fact the BRIC economies added together are only slightly larger than the US economy on its own. There is no way that the Rest of the World is going to avoid a recession if the US economy continues to shrink. Some will fare better than others, but all will be adversely affected to some extent.
So where does this leave us?
Well, the short answer is that we are headed for a prolonged period of economic pain, courtesy of the Wall Street Whizz Kids, the Politicians and the Central Bankers. They ought to be tarred and feathered because much of this pain that we are about to experience will more exaggerated than it would have been if the “authorities” had allowed Nature to take its course. In simple English, there is no such thing as a magic pudding. You cannot create wealth by manning the printing presses. The harsh reality is that type of action destroys wealth. It digs an ever deeper hole.
Can we dig our way out?
The short answer to this is “yes”. But it will take around 10-15 years. What is needed is the introduction of a new energy paradigm that will provide an alternative source of base-line energy and the technologies which hang off this source of baseline energy.
The chart below shows just how far we are from achieving the objective of moving away from our dependence on fossil fuels: (source: Nuclear Energy in the 21st Century, World Nuclear University Press, Ian Hore-Lacey, 2006)
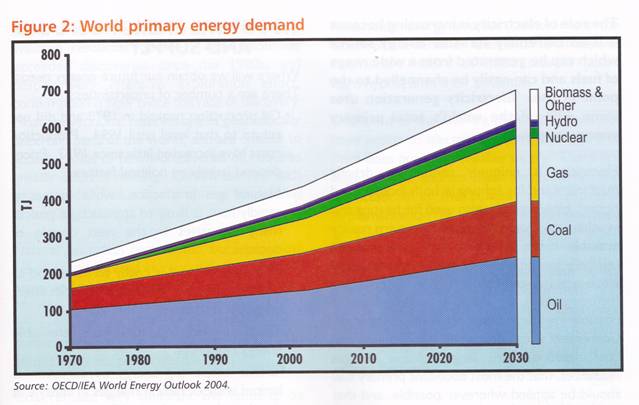
Okay, but if we need to move away from our dependence on fossil fuels and the chart shows that this is not being forecast to happen, then how are we going to dig ourselves out? How is humanity going to adapt its collective behaviour to survive? If Al Gore and the IPCC are to be believed we cannot continue to spew Carbon Dioxide into the atmosphere. The chart above is dramatically at odds with what the Carbon Dioxide evangelists are “demanding”.
One potential answer lies in Beyond Neanderthal, which is a light hearted novel that explains – via an entertaining storyline – specifically how we arrived at this cross roads in our history and presents one conceptual approach regarding what we might do about it. The novel may be ordered via the website below or from Amazon.
Another answer “might” lie in Nuclear Fission. I am currently researching this particular subject which will represent the primary theme of my next novel which, unfortunately, will likely not be available for another 2-3 years. Nuclear Fission is proving to be an extraordinarily thorny and emotive subject from which the layers of dogma need to be carefully peeled away. There are vested interests both for and against the mainstream nuclear fission technology/ies.
But the bottom line is this: If you think that you are going to make capital gains over the next 10-15 years from investing in mainstream industrial shares at an entry price of 19X P/E based on forecast earnings, then you are likely to be deeply disappointed.
Equally, you are likely to be disappointed if you think you will make capital gains from lending to the US Government via its treasury bonds – as can be seen from the chart of the 30 year Bond Price below (courtesy DecisionPoint.com):
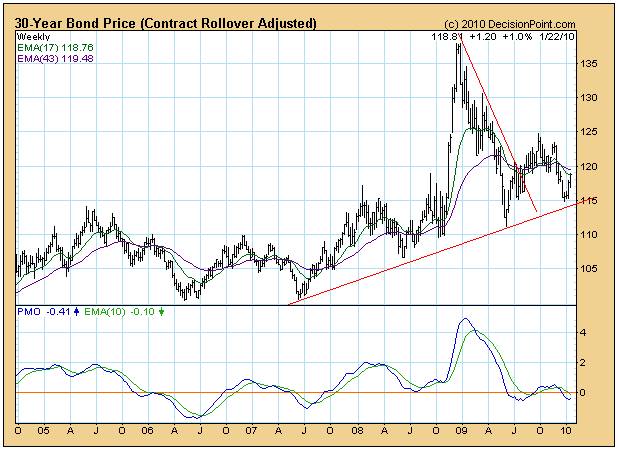
What this chart shows is that whilst the rising trend line is intact, there has been a technical non confirmation by the Price Momentum Oscillator, which implies that bond prices are more likely to flatten than to rise in the medium term. (Note that the June 2009 bottom is lower than the June 2008 bottom and that the 2010 top is lower than the 2008 top). Arguably, based on fundamentals, a structural rise in bond yields is well within the bounds of possibility.
In this analyst’s view successful investors in the future are going to make capital profits in the old fashioned way – by backing hand picked entrepreneurs who will be in wealth creation mode in industries that are addressing structural needs; and by sticking with and supporting these entrepreneurs for years while they are building their businesses. The flip side of this is that entrepreneurs are going to have to learn the hard way that they are accountable to shareholders and can be fired if they do not deliver on their promises.
The market driven structural needs that will be most easily visible will likely lie in:
- The medical field with technologies that will give rise to cost reductions. (In the US, the ratio of health services expenditure to GDP is trending towards 20% and this is quite simply unsustainable. If vested interests are allowed to prevail the entire medical infrastructure of the USA will be placed at risk of collapsing. The issue has more to do with over-servicing and less to do with emotional have/have not arguments. In simple terms, vested interests are over servicing and this has to be eradicated. Technologies which facilitate a reduction of over servicing will add enormous value because they will also bring specialized medicine within reach of the ordinary man in the street.)
- The precious metals industries are likely to play a role in a restructured financial system that is likely to emerge over time. (I particularly like gold for reasons that go beyond financial arguments. Its early days yet, but medical research is discovering an intriguing relationship between gold and DNA. My personal view is that $5,000 an ounce for gold is not outside the bounds of possibility within the foreseeable long term future )
- Alternative (to fossil fuel) energy technologies that have the capacity to provide baseline energy.
- Agriculture and agricultural commodities which will facilitate the provision of food to a growing world population
- Water – given that the human body is comprised over 50% of water and given that without potable water the human body cannot survive.
At the end of the day, pessimistic readers might be well advised to bear the following in mind:
“Life isn’t about waiting for the storm to pass. It’s about learning to dance in the rain”.
In conclusion, the track record of this analyst is there in black and white for all to see. Tens of thousands of people in over thirty countries have read my blogs over the past 8 odd years. The evidence shows that I have called the Primary Direction of various markets fairly accurately. Now it’s time for you to act. There are some valuable lessons to be learned between the pages of Beyond Neanderthal and we will both benefit from your buying the book. Maybe, if enough people read the book it might even have an impact at society level. However, with the breakdown in the US industrial equity market now manifesting the time has come for me to focus my attentions elsewhere for the foreseeable future. Nevertheless, as Arnie once put it: “I’ll be back”. J
By Brian Bloom
Once in a while a book comes along that ‘nails’ the issues of our times. Brian Bloom has demonstrated an uncanny ability to predict world events, sometimes even before they are on the media radar. First he predicted the world financial crisis and its timing, then the increasing controversies regarding the causes of climate change. Next will be a dawning understanding that humanity must embrace radically new thought paradigms with regard to energy, or face extinction.
Via the medium of its lighthearted and entertaining storyline, Beyond Neanderthal highlights the common links between Christianity, Judaism, Islam, Hinduism and Taoism and draws attention to an alternative energy source known to the Ancients. How was this common knowledge lost? Have ego and testosterone befuddled our thought processes? The Muslim population is now approaching 1.6 billion across the planet. The clash of civilizations between Judeo-Christians and Muslims is heightening. Is there a peaceful way to diffuse this situation or will ego and testosterone get in the way of that too? Beyond Neanderthal makes the case for a possible way forward on both the energy and the clash of civilizations fronts.
Copies of Beyond Neanderthal may be ordered via www.beyondneanderthal.com or from Amazon
Copyright © 2010 Brian Bloom - All Rights Reserved
Disclaimer: The above is a matter of opinion provided for general information purposes only and is not intended as investment advice. Information and analysis above are derived from sources and utilising methods believed to be reliable, but we cannot accept responsibility for any losses you may incur as a result of this analysis. Individuals should consult with their personal financial advisors.
Brian Bloom Archive |
© 2005-2022 http://www.MarketOracle.co.uk - The Market Oracle is a FREE Daily Financial Markets Analysis & Forecasting online publication.
Comments
|
Mike
27 Jan 10, 19:03 |
Evolution of Infrastructures
On your graph of infrastructures I think that "Internet" follows: Canals, Railroads, Paved Roads, Airways. The timing looks right too. |