Britains Population Growth and Ageing Demographics Impact on UK House Prices
Housing-Market / Demographics Sep 12, 2010 - 03:10 AM GMTBy: Nadeem_Walayat
 The long-term battle being played in the UK housing market is that of new build supply always trying to play catchup with ever increasing demand as a consequence of the UK's growing population and changing demographics which is set against many other developed countries that are either experiencing falling populations such as Germany or have ample space to build far beyond that demanded as a consequence of population growth such as the United States. Therefore this analysis as part of a series on the UK housing market seeks to gauge the likely impact of population growth and demographics on UK house prices over the next 10 years.
UK Population Growth Forecast Conclusion
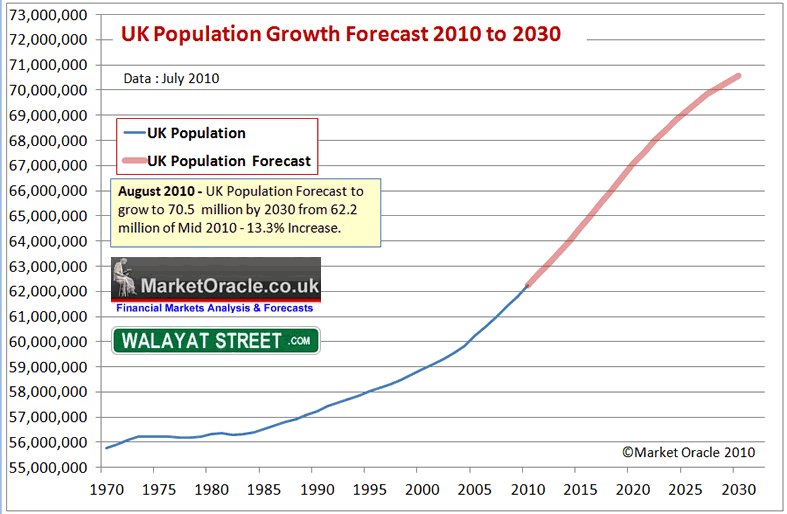
The recent analysis (02 Aug 2010 - UK Population Growth and Immigration Trend Forecast 2010 to 2030) concluded in the following UK population growth forecast -
The assumptions being factored into the UK population growth forecast are for a natural UK population growth rate of births exceeding deaths of 0.33% per year (current 200k), coupled with net average current immigration trend of 240k per year, supplemented with climate change refugees averaging 50k per year from 2015 onwards extrapolates into the following trend forecast over the next 10 years that targets a rise from 62.2 million as of mid 2010 to 67 million by mid 2020, and should the same trend be maintained beyond 2020 then the UK population could rise to above 72 million by mid 2030. However in all probability the country will not experience the post 2020 trend due to several converging factors including political pressures, capacity constraints and the UK's relegation in the economic prosperity leagues. Which implies a tapering off of net immigration in favour of natural growth which implies a lower total of nearer 70.5 million by 2030 as illustrated by the below graph.
UK House Building and Population Growth
The below graph shows the UK annual population change against annual new housing build completions.
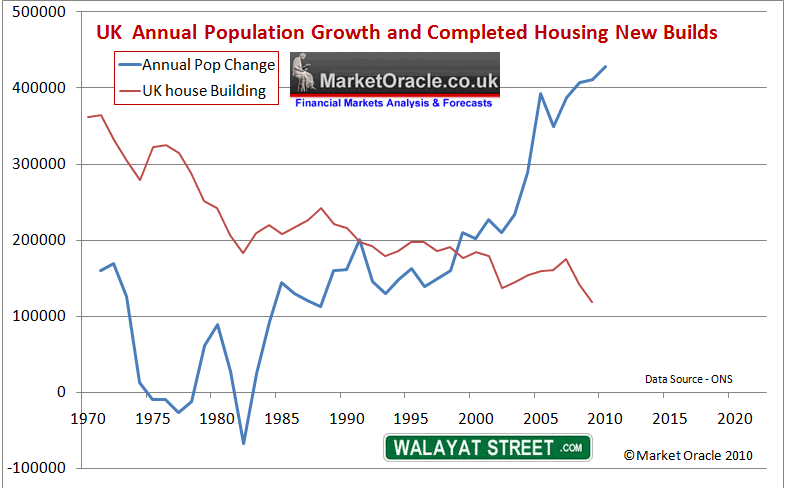
The graph illustrates a major long-term shift took place in the UK housing market dynamics by 2000 when the annual increase in population far exceeded the number of new builds that ended the preceding trend for construction to exceed population growth in terms of addressing the UK's chronic long standing housing shortage, especially considering that the average size of households has continued to shrink falling from 3.1 in 1960 to just 2.4 in 2010 (one of the smallest in the world) as a consequence of the increase in single person households and single parent families.
The below graph shows the ratio between the accumulative change in population since 1970 against the accumulative number of new housing builds also since 1970 as a UK Over Crowding Ratio.
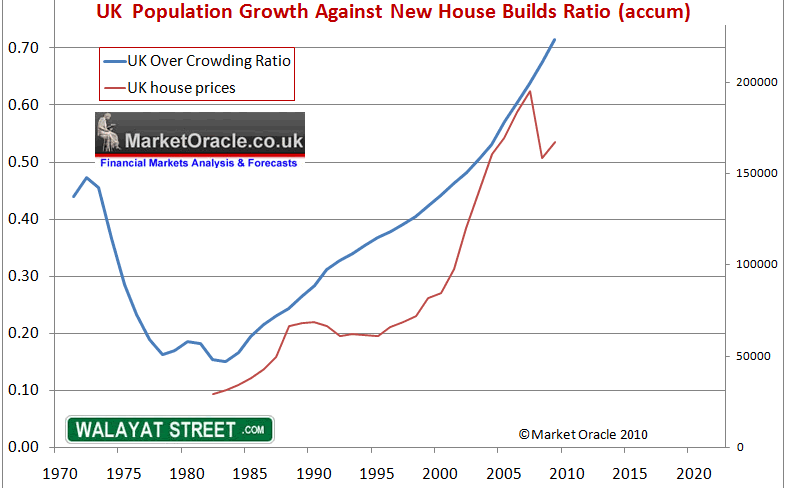
The above graph better illustrates the change in trend that took place starting in the mid 1980's that coincided with the Thatcher governments reversal of the policy for the construction of social housing and implementation of the right to buy programme for the sale of millions of socially owned local council housing that ignited the property boom of the nineties AND noughties, the trend that was set in motion was for the inability of supply to keep pace with population growth, which ensured persistent upward pressure on house prices that despite the recession still shows an accelerating trend as new build supply that currently stands at an estimated 120k to 140k per year is set against government estimates for a requirement of 240k per year which thus ensures that the UK's over crowding situation is expected to continue to deteriorate year on year going forward, especially if the size of average households continues to shrink which requires ever more housing even if the population stopped increasing.
Implications for House Prices
New build supply plays an important part in the housing market as it tends to average at approx 10% of the total number of annual transactions, which is more than enough to have a significant effect on the UK housing market especially as supply over recent decades has been consistently below that which is deemed necessary to meet he demands of a growing population which means that the UK housing market is destined NOT to replicate the housing busts of countries such as the United States or even closer to home of countries such as Spain, where that housing bust has prompted many hundreds of thousands of British ex-pats to cut their losses and return to the UK, closely followed by unemployed Spanish and other PIIGS citizens seeking employment in a more liberal and robust UK jobs market and thus introduce new demand into the UK housing market.
This suggests that the often put forward industry affordability ratios such as X3.5 salary as the likely outcome path for the UK housing market does not accurately take into account the new demand against new supply trend that implies affordability ratios look set to be pushed ever higher to new trend extremes, therefore supporting long-term price trends for UK house prices in real terms, i.e. expensive UK house prices look set to be here to stay for as long as the lack of new supply exists, especially as the UK population is expected to grow by 5 million over the next 10 years against an realistic estimated construction of just 1.2 million new homes.
Population Growth Feeding the Inflation Mega-trend
The impact of an increase in UK population over the next 10 years by 7.7% is expected to continue to feed Britain's INFLATIONARY MEGA-TREND for the next decade as rising population puts extra pressure on Britains capacity constrained infrastructure, pressure on consumer and asset prices, especially house prices and associated costs as well as contributing economically to an increase in nominal GDP growth. Whilst maintaining the expected trend that UK unemployment will remain high for the duration of the next 10 years, no matter what job creation initiatives the government attempts to implement to reduce stubbornly high unemployment levels as between 70% and 80% of new jobs created are likely to go to migrant workers as was the experience under the last Labour government.
Britain's Demographic Time Bomb Has Gone Off!
Britain's demographic time bomb is illustrated by an ever growing ageing population that despite an increasing number of workers cannot maintain ratios of the past, where 20 years ago there were 8.9 million pensioners against 28 million workers or a ratio of 3.15 workers to every retiree (15.5% of the total population), today there are over 11.5 million pensioners to 30 million workers, a ratio of 2.6 to 1 (18.5% of the total population). Britain's retiring population demands an ever greater share of the economic pie that will increasingly impact hard on the economy as each retiree turns from a tax payer to a retirement benefits claimer.
The impact of this on the UK Housing market is for increasing supply from the lower middle to upper middle range of properties as a significant number of the elderly downsize or move into retirement homes, this is coupled with less real disposable income for the wage slaves to pay for house purchases which on face value implies a persistent real terms deflationary outcome for UK house prices over the next 20 years.
However against an ageing population that looks set to see the number of retirees increase from approx 11.5 million today to 13.5 million by 2020 the impact of this will be partially offset by Britains rising population from 62 million to 67 million (20% of the population), which whilst putting Britain in a far better state than many other countries who's total population and worker base is shrinking as well as experiencing an increasing ageing populations such as Japan, however an 8% increase in the total population against a 17% increase in retirees is not going to offset the impact on the increasing number of retirees as the ratio of workers to retirees continues to fall, especially as this trend is likely to continue for at least the next 25 years with the number of retirees expected to hit 17 million by 2035 which suggests a ratio of 1.9 to 1 (workers per retiree), which implies a gradual loss of real purchasing power of every workers earnings over the next 25 years.
Thankfully it is not all gloom and doom as the new government as well as future governments will fully recognise the exploding demographic time bomb and thus will actively engage (belatedly) in an attempt to alleviate the disastrous long-term consequences by both gradually raising the retirement age, which will probably extend all the way to 70 by 2025, as well as cutting the burden of costs that are presently dumped onto the tax payers. Whilst both ends of the spectrum i.e. those retiring in the near future and those just entering the workforce will feel outrage at their own increasing costs, however there is no way out of the demographics crisis other than for unpopular policies to be implemented as the alternative would be an hyperinflationary depression, as weak successive governments kept putting off the difficult decisions by taking the easy option of just printing money and monetizing government debt (as was the policy of the last Labour Government) which would wipe out the purchasing power of both earnings and savings and give the illusion of growth.
Other positive developments in recent years has been to address the problem of ageism so that people above a certain age are no longer seen as unemployable, the UK in this regard has come a long way over the past 10 years which coupled with extension of the retirement age should be seen as a positive trend until ultimately retirement would be resigned to the history books much as communism has been. After all retirement was never a sustainable policy as it was built upon the assumption that the ratio of workers to retirees would be sustainable at above X3, instead of now trend towards below X2.
Whilst more elderly in the workplace over recent years has resulted in an improvement in the overall economy in terms of productivity in utilising what would have been an idle workforce, however as mentioned earlier, it does not resolve the tax and debt burden being placed onto future generations, which does confirm my view that at some point the retirement age will be scrapped altogether and along with it the state retirement pension to be replaced with a form of income support for low paid elderly workers, along the same lines as the current tax credits system.
The objection put forward against an effective end to retirement is that it takes jobs away from the young, however this is a false premise as those starting out at the beginning of their careers are at a different stage of development than those that are in the last few years of their career, just as those in their 40's usually do not compete against those in their 20's therefore even less so will those in their 60's and 70's, if anything it will allow for more efficient transfer of knowledge and experience between old and young workers rather than having an artificial cut off date.
UK Real Unemployment Rate is 5.5 million - Britains Benefits Culture
Whilst the focus of this analysis so far has been the ratio of workers to retirees, however Britain also carries the burden of its benefits culture which has more than 8.2 million people of working age who are sat idle, this is set against the official unemployment rate of just 2.5 million which results in an unrecorded economically inactive gap of an enormous 5.5 million which illustrates the true extent of the failure of the last Labour government to manage the potential of the work force during the boom years as illustrated by the fact that 80% of the 2.1 million jobs created under Labour went to foreign workers and therefore did nothing to address the true level of UK unemployment that contained a hidden ticking social security financing time bomb that has exploded as a £40 billion extra annual budget deficit.
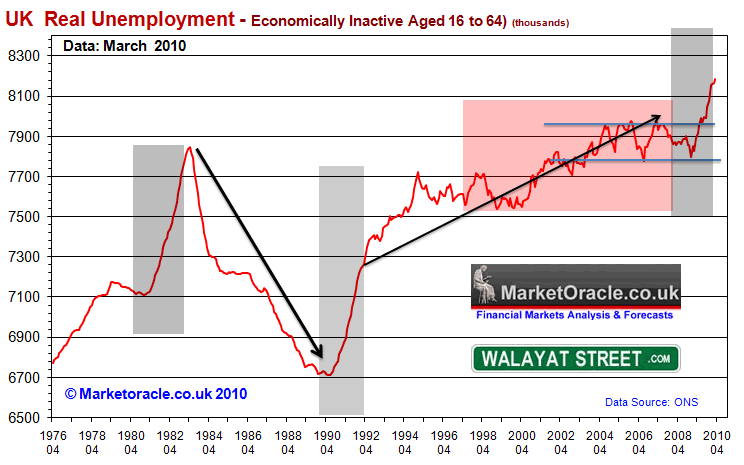
Off course not all of those that are economically inactive can work such as through disablement or long-term illness, nevertheless the real level of unemployment if including those that can work but choose not to work then the real level of unemployment is nearer to 5.5 million than the official level of 2.5 million.
Therefore the current government is correct in recognising this huge and unsustainable burden on the state by intending to implement serious measures to force those of working age to actively seek employment rather than remain a burden on the state for their entire working lives and then again during retirement, which would have the dual effect of turning many millions of today's benefit claimers into tomorrows tax payers.
Population Growth and Demographics, Housing Supply Conclusions for UK House Prices
This analysis concludes towards three competing forces driving UK house price trends - an increasing population that generates ever increasing demand for housing that supply has never been able to keep pace with, several millions who have permanently sat on benefits being forced into the workforce and thus increase demand for housing, against an ageing population that looks set to put downward pressure on the housing market for several decades as many elderly seek to downsize into retirement homes and probably soon to be built retirement villages, the overall implications are for long-term real terms price stagnation as ever more resources will continue to be expended on servicing the demands of an ageing population, whilst high inflation acts to drive up prices in nominal terms. This does not mean there will not be future booms in house prices, just that it is highly likely that they will be more subdued in real terms than that which has occurred during the past 10 years as there will be increasing supply overhanging the market ready to sell at higher prices.
In terms of the trend for the next 10 years, the implications are for a real terms stagnating market for the next 2-3 years, followed by weak real-terms growth, with nominal house prices supported by the governments inflationary policies in an attempt to mask the true economic impact of an ageing population through the illusion of increasing wages whilst real purchasing power falls, which again reaffirms the importance of inflation forecasts being accurate as that will be the primary driver for nominal house prices for the next 25 years as covered at length in the Inflation Mega-Trend Ebook (FREE DOWNLOAD).
UK House Price Forecast
This analysis is part of an on going series that will culminate in a multi-year UK house prices trend forecast (Free Ebook) that will seek to more than replicate the original 2 year bear market forecast of August 2007 made right at the very peak of the UK housing market (22 Aug 2007 - UK Housing Market Crash of 2007 - 2008 and Steps to Protect Your Wealth ), which also builds up on the 100 page Inflation Mega-Trend Ebook of Jan 2010 (Free Download Now), which contained the following UK housing market analysis (updated graph):
UK Housing Bear Market Election Bounce
The UK housing market peaked in August 2007 and entered into a 2 year bear market exactly as forecast at the time (22 Aug 2007 - UK Housing Market Crash of 2007 - 2008 and Steps to Protect Your Wealth ), analysis which projected towards a fall in UK house prices from August 2007 to August 2009 of between 15% and 25% that has subsequently came to pass as UK house prices bottomed in March 2009 after having fallen by 23% from the 2007 peak.
The UK housing bear market has experienced a strong bounce off of the March 2009 lows and now stands up approx 10% off of the low as a consequence of unprecedented measures as mentioned in this ebook, the Labour government has succeeded in temporarily bringing UK house price falls to a halt and triggering an Election Bounce.
The impact of the inflation mega-trend on the UK housing market will be for UK house price to be supported in nominal terms, however this it does NOT ignite the feel good factor that triggers housing market booms which only follow when house prices begin to significantly rise in REAL terms i.e. after inflation.
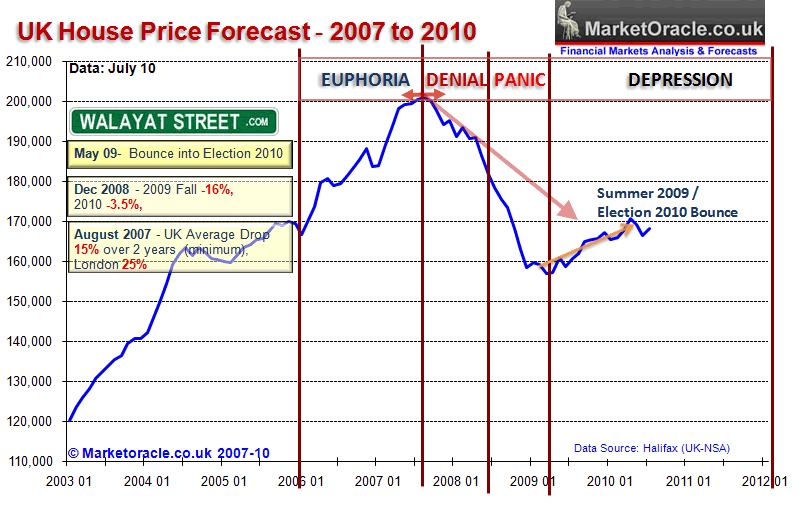
Whilst the current corrective bounce looks set continue into the middle of 2010 (allowing for a potential one month blip as a consequence of the bad January weather), this rally is still seen as a correction within a housing bear market that is expected to remain in a depression for many years, before house prices succumb to the effect of the inflation mega-trend and start to rise.
Ensure you are subscribed to my always free newsletter to receive key in depth analysis on the UK housing market, economy and markets in your email in box on an ongoing basis.
Comments and Source : http://www.marketoracle.co.uk/Article22616.html
By Nadeem Walayat
Copyright © 2005-10 Marketoracle.co.uk (Market Oracle Ltd). All rights reserved.
 Nadeem Walayat has over 20 years experience of trading derivatives, portfolio management and analysing the financial markets, including one of few who both anticipated and Beat the 1987 Crash. Nadeem's forward looking analysis specialises on UK inflation, economy, interest rates and the housing market and he is the author of the NEW Inflation Mega-Trend ebook that can be downloaded for Free. Nadeem is the Editor of The Market Oracle, a FREE Daily Financial Markets Analysis & Forecasting online publication. We present in-depth analysis from over 500 experienced analysts on a range of views of the probable direction of the financial markets. Thus enabling our readers to arrive at an informed opinion on future market direction. http://www.marketoracle.co.uk
Disclaimer: The above is a matter of opinion provided for general information purposes only and is not intended as investment advice. Information and analysis above are derived from sources and utilising methods believed to be reliable, but we cannot accept responsibility for any trading losses you may incur as a result of this analysis. Individuals should consult with their personal financial advisors before engaging in any trading activities.
Nadeem Walayat Archive |
© 2005-2022 http://www.MarketOracle.co.uk - The Market Oracle is a FREE Daily Financial Markets Analysis & Forecasting online publication.


