


Crude is hyper bullish while Gold is trying to find a bottom
Commodities / Commodities Trading Dec 24, 2010 - 04:54 AM GMTBy: Bari_Baig

 We start with Commodities today and they are strong regardless of the fact that U.S Dollar has been a lot stronger in last week but first and foremost, Crude WTI which we went all out bullish off 2 days back as we wrote “WTI is now trading at a discount of $3.51 to Brent and as Brent is making new highs then WTI must follow too and we mince our words at that”. As we write Crude WTI is now trading at $91.40 and Brent is still maintaining a healthy distance of nearly $3 even after WTI has pushed upward rather sharply.
So, what was the catalyst yesterday that pushed crude WTI higher, finally snapping out of the $2 per barrel band it was stuck in? Many are of the view that it was drop in the DOE inventories but we hate to differ for one reason and one reason alone; had DOE inventories would have played the role then Crude would have snapped out from the band last [Wednesday] when the drop was even greater than yesterday’s reported numbers and thus we wrote last week “if you don’t rise on a bullish news, you’re not bullish to begin with”. One might try to give some credit to the weather but that too also checks out at almost similar conditions since last week. So why now Crude breaks the band when absolutely nothing has changed? If the previous two aren’t enough than we also have the contango which was narrowing last week and it is narrowing even now, Brent and Crude went into backwardation then and today it is Brent which is still in backwardation but not WTI.
So, what really happened? To us the best plausible explanation is the spread between Brent and WTI. We have paid more heed to the spread since August of this year than to the contango but now both seem to be screaming out loud a material change in demand and supply. As we said earlier, prices seem destined to higher levels and we need not say much thus we mince our words at that.
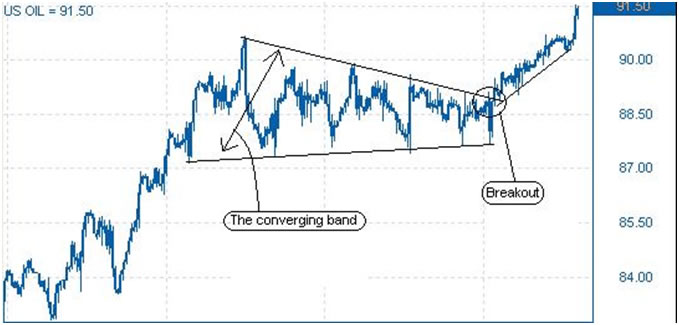
The chart above shows consolidation in a converging pattern which may potentially be a midpoint of the full move which could stretch all the way up to $99 per barrel.
Now, looking at gold which to us seems would have managed to squeeze the last of late longs out. As we write Gold is trading just under $1,380 still in the negative territory but earlier in the session dropped to $1371 at which point [We] became concerned. Before gold pressed ahead earlier this month to post fresh new highs we termed the move up over $1,400 per ounce as a premature move and wrote in our article [When things get overbought you sell] that keeping in view the violent swings in gold it is very much capable of taking out the previous highs but that would be met with lots of resistance and now we’re in last week of December and Gold has done nothing material so far rather on December 1st it closed at $1,386s and currently Gold is trading $1,379, $7 off from Dec 1st close. Since Dec 1st to date, Gold has risen by $46 over Dec 1st close and fallen by $25 from the Dec 1st close which roughly puts the mean thus far at $1,392s.
So, for us Gold would begin the next leg up once it breaks over $1,393. What we are most relieved by is the fact that IMF which has been a major seller in last few weeks is done with its selling and has no more gold up for offer in the market. The commodity didn’t just exchange hand with one central bank but was picked up by many thus further reducing the threat of one “major” selling coming back to sell.
Now looking at the 4 hourly chart below we can see that Gold has managed to push outside the major trend line drawn from the highs of Dec 7th and gold price did bounce precisely from the downward trend and the channel support earlier today when we were taken aback after gold did a “touch and go” of that crucial region.
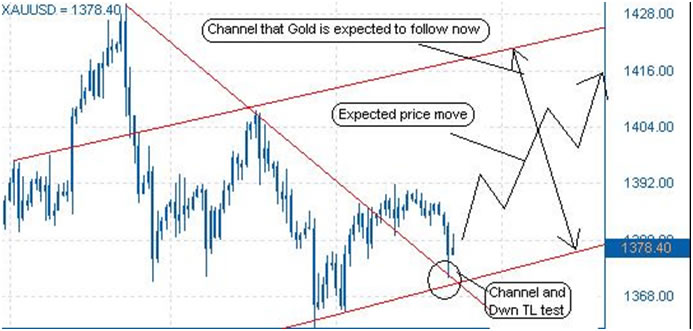
The chart also sheds light on instance selling by IMF and since selling stopped nearly 2 days back the price move looks much less volatile. We have advocated for a gradual move in the past and we advocate a similar move now. Once we break over $1,393 as mentioned above and hold it as a base the upward trend shall very much start all over again. We were and we remain bullish of gold.
By Bari Baig
http://www.marketprojection.net
© 2010 Copyright Bari Baig - All Rights Reserved
Disclaimer: The above is a matter of opinion provided for general information purposes only and is not intended as investment advice. Information and analysis above are derived from sources and utilising methods believed to be reliable, but we cannot accept responsibility for any losses you may incur as a result of this analysis. Individuals should consult with their personal financial advisors.
© 2005-2022 http://www.MarketOracle.co.uk - The Market Oracle is a FREE Daily Financial Markets Analysis & Forecasting online publication.