Stock Market Correction, How Long and How Deep?
Stock-Markets /
Stock Markets 2011
Mar 02, 2011 - 08:34 AM GMT
By: John_Hampson

 In my analysis of February 17th here, I suggested a stock market pullback was imminent but that the cyclical stocks bull was to continue longer term. It turned out to be timely, as we have been in correction since the 18th until today. So how long and how deep should we expect the market to consolidate or correct, and is the case for the underlying cyclical stocks bull to continue still as strong?
First, a note about yesterday, March 1st. It turned out to be a pivotal day, as many expected a push back to the highs powered by first-of-the-month seasonality. Instead we saw a steep and sustained decline. A geomagnetic storm began in the early hours of March 1st and intensified throughout the day, producing auroras over Northern Europe and North America. How is that relevant to the fortunes of the stock market? Read the second half of my February 5th analysis
here. Geomagnetic storms and stock market fortunes won't always go hand in hand, just as seasonality won't always fulfil. It is critical to embrace all disciplines that have some correlation with the markets.
Here's a recap of why a stock market correction appeared imminent. A window of negative seasonality, negative pressure around the full moon of February 18th and a cyclical downturn due, supported by the bull market sustainability index having moved into a range suggestive of a near term correction and retail investors and 'dumb' money having piled in, usually a contrarian signal. We had also experienced stretched readings for some time in sentiment surveys and call/put ratios.
In that analysis (
here), I also brought together Birinyi's comparative analysis of historical bulls and two historical rhyming bulls of 1974-6 and 2003-5, which together suggested shallower gains or consolidation over the next few months. Here is one more rhyming bull:
Source: The Big Picture
But before you get too bearish, recall that we are currently in a Presidential cycle sweetspot for equities, particularly for the first 6 months of this year, and there is the exceptional supportive role of QE/Pomo occuring into June (subject to Fed early ending - or extending). Read about its influence on the stock market
here. Nevertheless, some caution is warranted.
So what do the three rhyming bulls have in common? After a strong uptrend, like the one we have just been experiencing 2010-11, the market topped in a process of chop - up and down and overall sideways whilst market internals weakened. Several weeks or months of flirting with the highs, before a downtrend emerged (either a new bear market or a bull market consolidation period). Tops are typically a process. Therefore, if the strong bull into February 2011 is now ending, or taking a sustained breather, we should not expect an immediate downtrend but a period of market 'confusion'.
So let's look at changes in longer term market internals and cyclical bull health measures since February 17th, when the picture was strong.
1. Leading indicators have risen further, suggesting accelerating growth ahead (subject to capped gains in the oil price).
2. The earnings season finished with an overall 66% earnings beat rate and 69% revenue beat rate, supportive of further gains for stocks.
3. The US yield curve is still relatively normal but flipping between bear-steepening and bull-flattening.
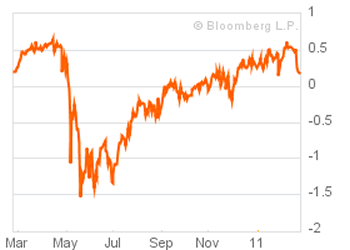
4. The Bloomberg Financial Conditions index has however fallen, and although still positive, needs watching.
Source: Bloomberg
So a couple of reasons for caution (3. and 4.), but in terms of what hasn't changed, we still see a cyclical bull in good health: market breadth, money supply and money velocity, stocks relative cheapness to bonds, interest rates, inflation rates, treasury yields.
In terms of timing the end of the cyclical bull: comparing the historic internals of this bull, timing by solar cycles, and estimating when we will reach treasury yield levels, inflation rate levels and interest rate overtightening that typically mark the end of cyclical bulls, then 2012 is currently the earliest we should expect.
All things considered, the cyclical bull remains in good health and should sustain for some time, and the likelihood is that we are experiencing a bull market correction. By cycles, this downturn should last an average of 4 weeks, and we should see an adequate resetting of indicators that had reached relative extremes, such as sentiment surveys and overbought technical readings. QE/Pomo and the Presidential cycle, leading indicators and earnings, should then be supportive of further gains into mid-year. However, comparing historical bulls at this stage, we should expect such gains to be hard-won in this period, before the cyclical bull accelerates again in its 3rd and 4th phases from later in 2011 into 2012/2013.
So in terms of strategy, I want to play the long side of the stock market until the cyclical bull ending measures are flashing and/or the cyclical bull health measures turn negative. By time, I will be generally looking for this correction to last 3 weeks or more, and by indicators I want to see sufficient resetting. April is a seasonally strong month for the market, both generally and in pre-election years, averaging 1.4% gains over the last 80 years. Later in March we may therefore see alignment of these factors and a good buying opportunity. I don't currently want to play the short side in the face of QE/Pomo and the other listed tailwinds. However, if this is were a market top then we should see a process of chop around current levels lasting into mid-year whilst cyclical bull health measures weaken, which would then provide a more compelling shorting opportunity.
John Hampson
www.amalgamator.co.uk
John Hampson, UK / Self-taught full-time trading at the global macro level / Future Studies
www.amalgamator.co.uk / Forecasting By Amalgamation / Site launch 1st Feb 2011
© 2011 Copyright John Hampson - All Rights Reserved
Disclaimer: The above is a matter of opinion provided for general information purposes only and is not intended as investment advice. Information and analysis above are derived from sources and utilising methods believed to be reliable, but we cannot accept responsibility for any losses you may incur as a result of this analysis. Individuals should consult with their personal financial advisors.
© 2005-2022 http://www.MarketOracle.co.uk - The Market Oracle is a FREE Daily Financial Markets Analysis & Forecasting online publication.