


Stock Market Inflection Point
Stock-Markets / Stock Markets 2013 Sep 14, 2013 - 05:16 PM GMTBy: Tony_Caldaro

 The market staged a surprise this week, continuing its rally from the August 29th low at SPX 1628, by gapping up the first two days and hitting SPX 1690 by Thursday. We had expected the market to run into resistance at the SPX 1658-1667 range and even the OEW 1680 pivot range. But it managed to exceed both. For the week the SPX/DOW were +2.5%, the NDX/NAZ were +1.55%, and the DJ World index was +2.3%. Economic reports came in with a positive bias. On the uptick: wholesale/business inventories, retail sales, the PPI, the M1 multiplier, the WLEI, plus weekly jobless claims and the budget deficit improved. On the downtick: consumer credit/sentiment, and export/import prices. Next week we have industrial production, the FOMC meeting, housing reports and options expiration.
LONG TERM: bull market
From time to time, during bull and bear markets, the market takes an unexpected path. This past week was one of those times. Occasionally an unexpected turn suggests a complete review of the long term trend. That is not required at this time, as the path was up and we are still in a bull market. The recent confirmed downtrend did not resume, as expected, and the market ended the week closer to its highs then its recent lows. This sudden reversal has many questioning their wave counts, both medium and longer term. While we do recognize there are several possibilities. We choose to remain with the counts posted on the SPX and DOW charts.
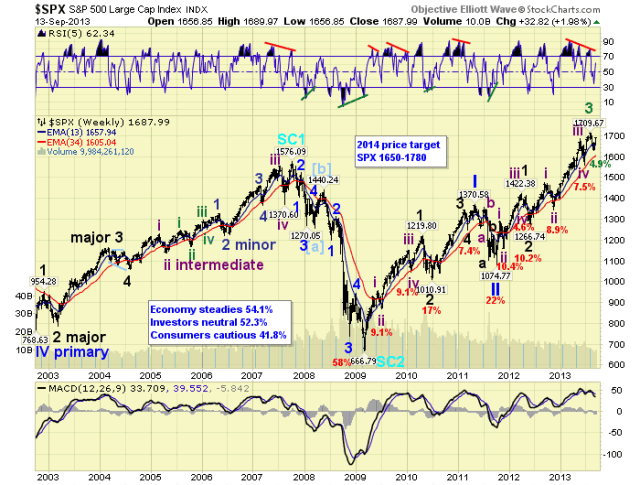
This Cycle wave [1] bull market continues to unfold in five Primary waves. Primary waves I and II completed in 2011, and Primary wave III has been underway since then. Primary I divided into five Major waves with a subdividing Major wave 1. Primary III has also divided into five Major waves, but both Major wave 1 and 3 have subdivided. Major waves 1 and 2 ended by mid-2012. Major wave 3 recently ended in August, and possibly Major wave 4 as well. Should the DOW continue it rally to new highs, we would consider this uptrend Major wave 5. Should the DOW fail to make new highs and make lower lows, we would consider this a continuation of Major wave 4. In either case, the bull market is still not expected to end until late-winter to early-spring 2014.
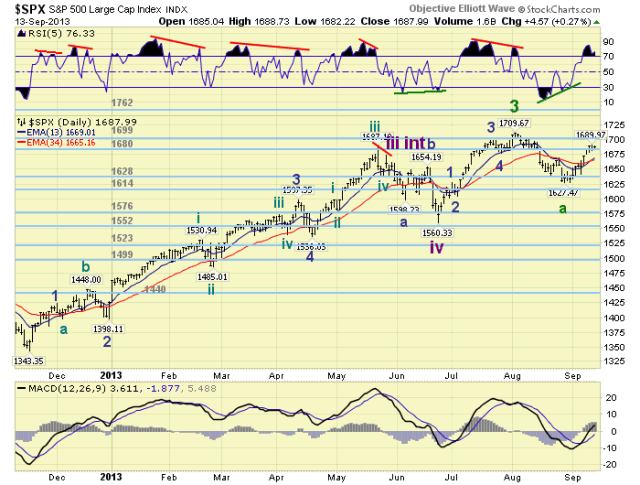
MEDIUM TERM: inflection point
After the early August high at SPX 1710, we anticipated the market had ended a Major wave 3 uptrend and was down trending in Major wave 4. We expected the downtrend to take about one month to unfold, and generally decline in a three wave sequence SPX: 1630-1670-1540. The decline was a bit slow to get going. It dropped to SPX 1639, rallied to 1670, and then declined to 1627. We accepted this second low as the end of the first major decline. This week, however, the market rallied past SPX 1670 to 1690. This was quite a bit more than we expected. During this bull market, however, B waves have sometimes pushed beyond the limits of expectations. Only to turn down to complete the downtrend. With this in mind we maintain a Major wave 4 count on the SPX charts: Int. A 1627, Int. B underway, and Int. C to follow.
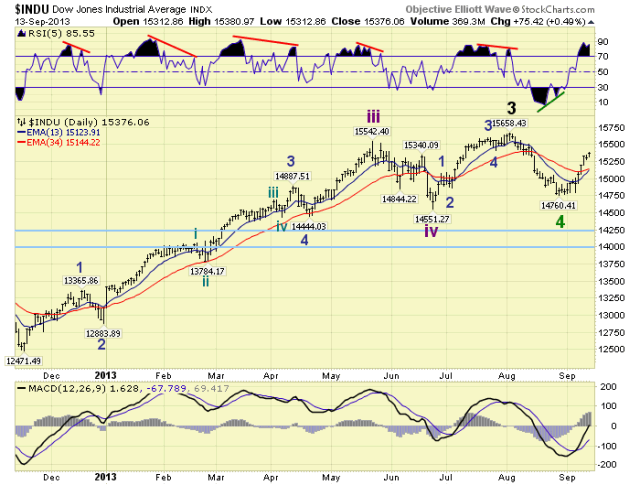
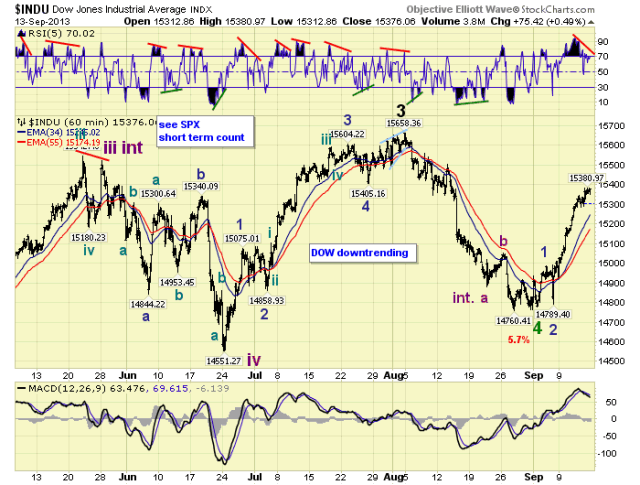
Remaining objective, we also offer an alternate count on the DOW charts. This count suggests Major wave 4 ended at the recent low, and a Major wave 5 uptrend is currently underway. This is the reason we suggest that the market is at a point of decision or an inflection point. As noted above. If the DOW makes lower lows Major 4 continues, higher highs Major wave 5 underway. Medium term support is at the 1680 and 1628 pivots, with resistance at the 1699 and 1762 pivots.
SHORT TERM
The recent rally started off quite choppy, but has recently turned impulsive. Another reason for the indecision inflection point. If it had remained choppy throughout, we would be more convinced of the Int. wave B scenario. Under this scenario the rally can be counted as a Minor a-b with Minor c underway.
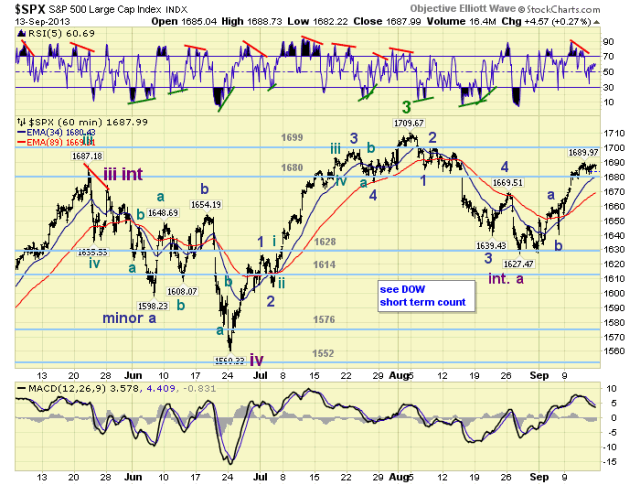
Under the Major wave 5 DOW scenario it can be counted as an Minor wave 1-2 with 3 underway.
Short term support is at the 1680 pivot and SPX 1658-1667, with resistance at the 1699 pivot and SPX 1710. Short term momentum is displaying a potential negative divergence. The short term OEW charts remain positive with the reversal level SPX 1674.
FOREIGN MARKETS
The Asian markets rallied 3.5% on the week. Indonesia, Japan and N. Korea have yet to confirm uptrends.
The European markets gained 2.6% on the week. All indices in uptrends.
The Commodity equity group gained 1% on the week. All uptrend here too.
The DJ World index is still in an uptrend gaining 2.3% on the week.
COMMODITIES
Bonds remain in a downtrend, but ended the week flat.
Crude is still in an uptrend, but lost 1.6% on the week.
Gold appears to be correcting losing 4.6% on the week.
The USD is still in an uptrend, but lost 0.9% on the week.
NEXT WEEK
Monday: NY FED at 8:30, then Industrial production at 9:15. Tuesday: the CPI and the NAHB housing index. Wednesday: Housing starts, Building permits, and the FOMC statement. Thursday: weekly Jobless claims, Existing home sales, the Philly FED and Leading indicators. Friday: Options expiration. Best to your weekend and week!
CHARTS: http://stockcharts.com/public/1269446/tenpp
http://caldaroew.spaces.live.com
After about 40 years of investing in the markets one learns that the markets are constantly changing, not only in price, but in what drives the markets. In the 1960s, the Nifty Fifty were the leaders of the stock market. In the 1970s, stock selection using Technical Analysis was important, as the market stayed with a trading range for the entire decade. In the 1980s, the market finally broke out of it doldrums, as the DOW broke through 1100 in 1982, and launched the greatest bull market on record.
Sharing is an important aspect of a life. Over 100 people have joined our group, from all walks of life, covering twenty three countries across the globe. It's been the most fun I have ever had in the market. Sharing uncommon knowledge, with investors. In hope of aiding them in finding their financial independence.
Copyright © 2013 Tony Caldaro - All Rights Reserved Disclaimer: The above is a matter of opinion provided for general information purposes only and is not intended as investment advice. Information and analysis above are derived from sources and utilising methods believed to be reliable, but we cannot accept responsibility for any losses you may incur as a result of this analysis. Individuals should consult with their personal financial advisors.
Tony Caldaro Archive |
© 2005-2022 http://www.MarketOracle.co.uk - The Market Oracle is a FREE Daily Financial Markets Analysis & Forecasting online publication.