


Commodities 2014 Halftime Report
Commodities / Commodities Trading Jul 14, 2014 - 03:34 PM GMTBy: Frank_Holmes

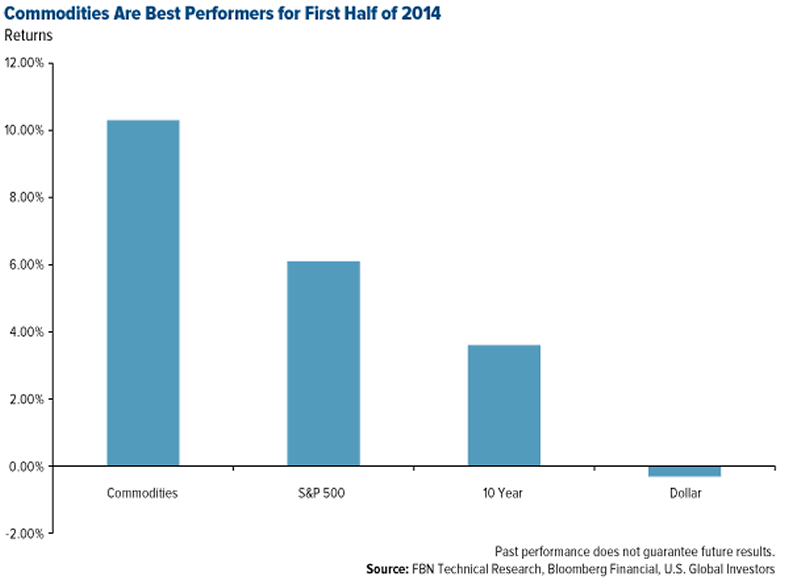
 What a difference six months can make. After a disappointing 2013, the commodities market came roaring back full throttle, outperforming the S&P 500 Index by more than 4 percentage points and 10-year Treasury bonds by more than 6.
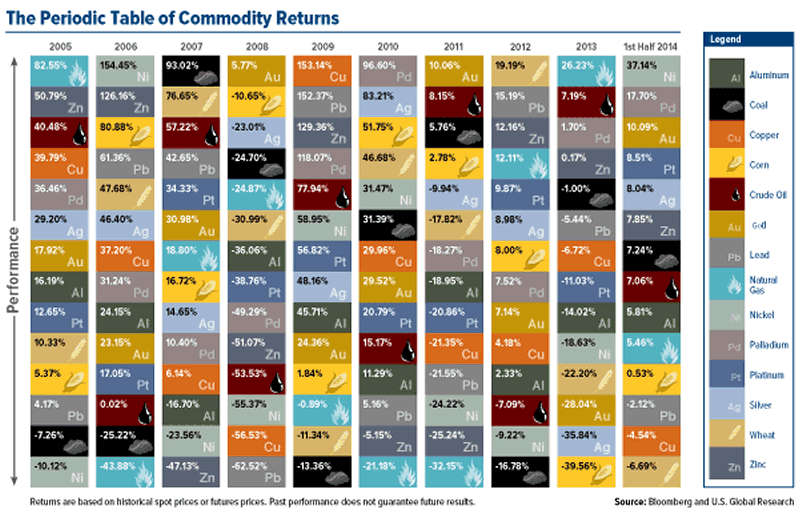
Leading the rally was nickel, delivering a 37.14 percent return, followed by palladium (17.70 percent) and gold (10.90 percent). Nickel also saw the largest gain from last year, climbing more than 55 points to settle close to $19,000 per metric tonne. Gold jumped 38 percentage points to $1,327 an ounce, and palladium rose 16 points to $843 an ounce.
At the back of the herd lagged lead, copper and wheat, which was the best performer only two short years ago.
Below you can see the 2014 halftime edition of our periodic table of commodity returns, which has proven to be a perennial favorite among our investors.
That commodity prices often fluctuate so wildly supports the need to have your investments in the resources space diversified and actively managed by an experienced team of professional investors. Simply put, there are far too many worldly factors—some of them political, others acts of God, all tugging and pulling at the market in tandem—for any one person to reasonably keep track of. It’s important to have a limber group of managers and analysts with the expertise and diligence to monitor and anticipate the most pressing global trends.
What we know is that now many investors have become bullish on resources. At a conference in New York at the end of last month, Credit Suisse polled 350 investors and found that 42 percent of them were planning to be overweight in commodities in the coming months. For some perspective, when the same question was asked of them the previous year, only 19 percent had a rosy attitude toward commodities.
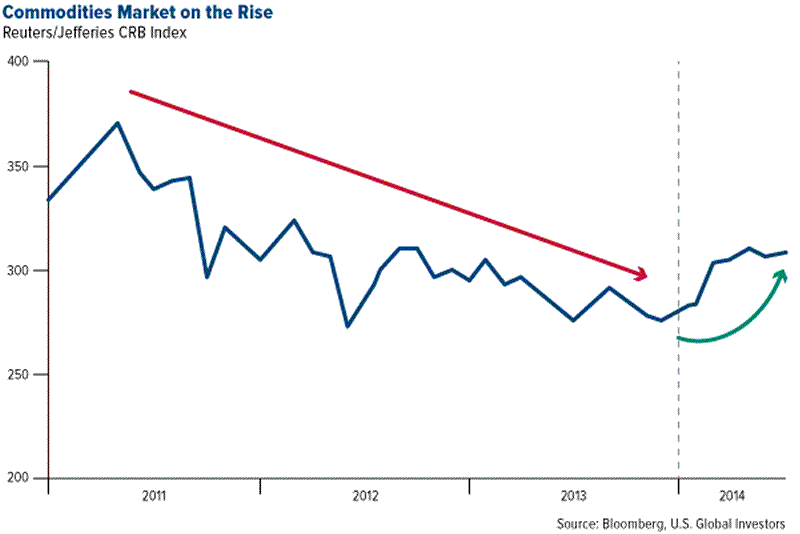
As I said, what a difference six months—or, in this case, a year—can make. With money flowing back into commodities, the market is finally trying to reverse the downtrend that we’ve been up against since 2011.
Nickel
As usual, government policy is often a precursor to change. Nowhere did we see this adage in action more transparently this year than in Indonesia, whose government shocked the market in January by enacting an outright ban on nickel ore exports. Because the Southeast Asian country is the world’s second-largest producer of nickel ore, accounting for about a fifth of global supply, any alteration to its export policy was bound to send far-reaching ripples throughout the market.
China, one of the leading importers of not just Indonesian nickel but other global raw materials as well, reacted by stockpiling the silvery-white metal, 75 percent of which is used worldwide in stainless steel production. This in turn encouraged investors to drive prices even higher out of fear of a supply shortage.
A repeal on the export ban is unlikely to happen in the near-term, as both Indonesian presidential contenders, Joko Widodo and Prabowo Subianto, who are both claiming victory in the recent election, favor its continuation. We will keep our eyes on nickel, as a correction might very well come when and if the ban is ever rescinded.
Palladium and Platinum
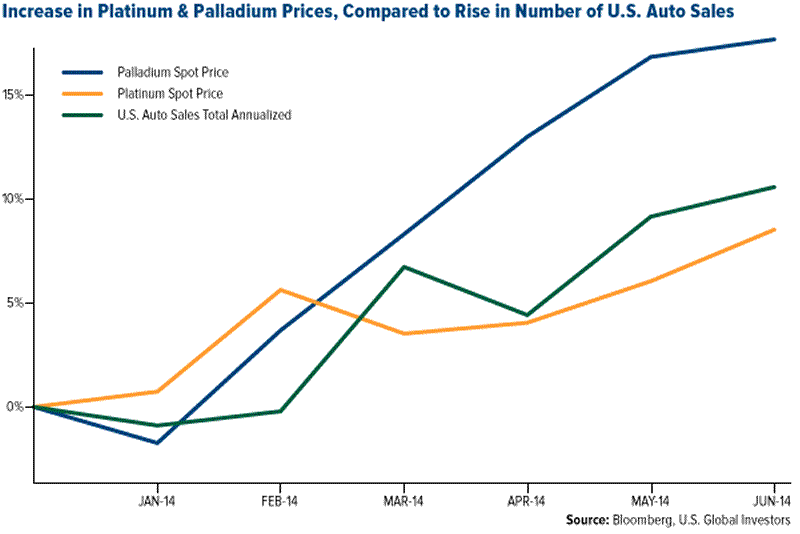
Prices of the platinum group metals (PGMs) hit three-year highs following the double whammy of a five-month-long miner strike in South Africa and trade sanctions against Russia, the world’s leading producer of palladium. Fear of a shortage in PGMs, which are essential to the production of catalytic converters in automobiles, drove prices skyrocketing.
This comes at a time when U.S. auto sales have surged to 16.9 million in June alone, an increase of 9.2 percent over the same time last year. Auto manufacturing is expected to grow 10.3 percent in the third quarter, according to International Strategy & Investment (ISS).
Although the labor strike ended last month, PGM production cannot reasonably resume within the next three to five months. And with a separate strike underway, this one led by the National Metalworkers of South Africa, country leaders fear yet another economic setback that has already threatened a third of South Africa’s manufacturing output.
 Gold
Gold
Our Gold and Precious Metals Fund (USERX), rated four stars by Morningstar,* continues to excel because we intimately understand the dynamics of both the Love and Fear Trade in the global gold market. We also know how to read and act on China’s positive purchasing managers index (PMI), which has recently hit a six-month high of 51. Any number over 50, of course, indicates strong growth in the manufacturing sector. China is already the world’s largest producer and consumer of gold, and because its middle class is swelling in rank—the country is expected to have over 670 million middle class citizens early next decade—gold sales should remain robust.
Besides China, other global drivers of gold consumption at this time include India and the Middle East. Diwali—otherwise known as the Indian Festival of Lights—Christmas and other international celebrations encourage generous giving of gifts, of which gold jewelry is one of the most traditional and popular. Ramadan, scheduled to end on July 28, involves a type of alms-giving called zakāt, which is one of the Five Pillars of Islam. Zakāt is obligatory for all observant Muslims, who handsomely give precious metals such as gold to those in economic hardship.
As I told Catherine Murray on BNN’s Business Day PM back in May:
So we’re coming to that trough on a seasonal pattern, and that seasonal pattern is predominated by what I call the Love Trade, where you have jewelry demand, et cetera, coming out of Asia, Middle East and India... And this is the first time that we had what they call the Flash HSBC PMI. And this is very important for job creation and GDP per capita rising, and that’s highly correlated with consumption of gold for the jewelry trade. So the second half [of 2014] looks great, and I think it’s also very important for all exports of any resources.
Crude Oil
Although not one of the top leaders in the first half, crude oil deserves a shout-out. Its 7.06 percent annual return is closing in on the 7.19 percent return in 2013, when oil was the second-best performer. Because of unrest in Iraq, North Sea Brent crude has set a record for trading between $107 and $112 a barrel for 12 consecutive months, handily beating the 170 consecutive days in 2008 when it traded over $100 a barrel.
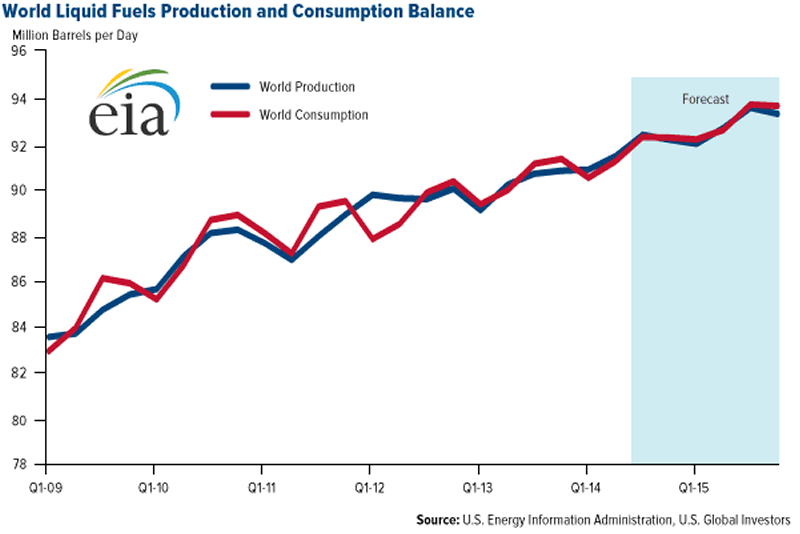
In its monthly energy report, the U.S. Energy Information Administration (EIA) forecasts that 2015 will represent the highest level of West Texas Intermediate (WTI) crude production since 1972. Global consumption of oil, driven largely by China once again, is expected to reach 94 million barrels a day (bbl/d) by the end of next year.
Global Resources Fund (PSPFX) portfolio manager Brian Hicks reiterates these points on why we are bullish in light of the current domestic oil production boom:
Within our portfolio, we are investing heavily in the shales through upstream oil and gas companies, oil services companies and equipment companies. Shale is transformational; it is really changing the energy landscape. Almost overnight, companies are developing resources that are long-lived and repeatable. Remember, only five years ago we were talking about peak oil. Now, we're producing roughly 8.4 million bbl/d. That's the highest we've seen since the mid-'80s. It is a trend that is going to continue.
Always Remaining Vigilant
Even though the commodities market has so far exceeded everyone’s expectations this year, especially following a lackluster 2013, a correction could occur with little warning. That’s why the portfolio managers of PSPFX, USERX and our World Precious Minerals Fund (UNWPX) are constantly looking out for opportunities and threats as well as ensuring that the fund is optimally diversified to protect against changes in the market.
For now, however, it appears as if resources could continue their strong performance for at least the near-term and hopefully much longer.
Want to receive more commentaries like this one? Sign up to receive email updates from Frank Holmes and the rest of the U.S. Global Investors team, follow us on Twitter or like us on Facebook.
By Frank Holmes
CEO and Chief Investment Officer
U.S. Global Investors
U.S. Global Investors, Inc. is an investment management firm specializing in gold, natural resources, emerging markets and global infrastructure opportunities around the world. The company, headquartered in San Antonio, Texas, manages 13 no-load mutual funds in the U.S. Global Investors fund family, as well as funds for international clients.
All opinions expressed and data provided are subject to change without notice. Some of these opinions may not be appropriate to every investor.Standard deviation is a measure of the dispersion of a set of data from its mean. The more spread apart the data, the higher the deviation. Standard deviation is also known as historical volatility. All opinions expressed and data provided are subject to change without notice. Some of these opinions may not be appropriate to every investor. The S&P 500 Stock Index is a widely recognized capitalization-weighted index of 500 common stock prices in U.S. companies. The NYSE Arca Gold BUGS (Basket of Unhedged Gold Stocks) Index (HUI) is a modified equal dollar weighted index of companies involved in gold mining. The HUI Index was designed to provide significant exposure to near term movements in gold prices by including companies that do not hedge their gold production beyond 1.5 years. The MSCI Emerging Markets Index is a free float-adjusted market capitalization index that is designed to measure equity market performance in the global emerging markets. The U.S. Trade Weighted Dollar Index provides a general indication of the international value of the U.S. dollar.
Frank Holmes Archive |
© 2005-2022 http://www.MarketOracle.co.uk - The Market Oracle is a FREE Daily Financial Markets Analysis & Forecasting online publication.