


US Government - The World’s Largest Subprime Debtor
Interest-Rates / US Debt Sep 24, 2014 - 06:22 PM GMTBy: David_Howden

 Lehman Brothers filed for Chapter 11 bankruptcy protection six years ago this month. The event has become famous as the spark that ignited the global financial crisis. Since that date, millions have lost their jobs and livelihoods, and countless others have seen their futures evaporate before their eyes, sometimes permanently.
At the heart of the crisis of 2008 was a common cause acknowledged by almost all commentators. Borrowers now infamously known as “subprime” (or more politely, “non-prime”) were the main reason behind the meltdown. As financial institutions extended loans to those with less than stable means to repay their debts, the foundation of the financial world was destabilized.
Six years on and these subprime debtors are largely a relic of the past. That fact notwithstanding, there is a new threat lurking in the global financial arena. This one borrower is far larger than all the previous subprime characters combined, and poses a far more dangerous hazard to the financial stability of nearly all (if not all) of the world’s citizens. I am speaking, of course, of the United States government.
Subprime borrowers are defined by FICO scores which are largely inapplicable to sovereign nations. We can instead look at the type of loans that these borrowers took on to understand how precarious the United States federal government’s finances are.
To simplify matters greatly, consider three types of loans that made debt attractive to subprime borrowers. The first was the adjustable rate mortgage. After a short period at a low introductory teaser rate, the interest rate would reset higher. Second was the interest only loan. Borrowers could take out a sum of money and for a period not worry about paying down the principal. An extreme form of the interest only loan is the final type: the negative amortization loan. In this case, not only does the payment not reduce the principal of the loan, it doesn’t even cover all the accrued interest! The effect is that each month that goes by, the borrower slips further in debt as interest deferral is added to the principal to be repaid.
In the wake of the crisis, a lot of commentators focused on two measures of the government’s financial stability. The first was its debt to GDP level, which was added to on a yearly basis by its deficit (also expressed as a percentage of GDP). At its nadir in 2010, the federal government ran a budget deficit of nearly 10 percent of GDP (the highest since World War II). As of today, the federal debt level (ignoring unfunded liabilities such as Social Security or Medicare) amounts to 102 percent of GDP.
While these numbers are indeed high, they really understate the problem. After all, the denominator in both cases is the total income of the whole United States, not just that of the government.
To get a better feel for these figures, consider how much the federal government borrows as a percentage of its income (the sum of its tax receipts).
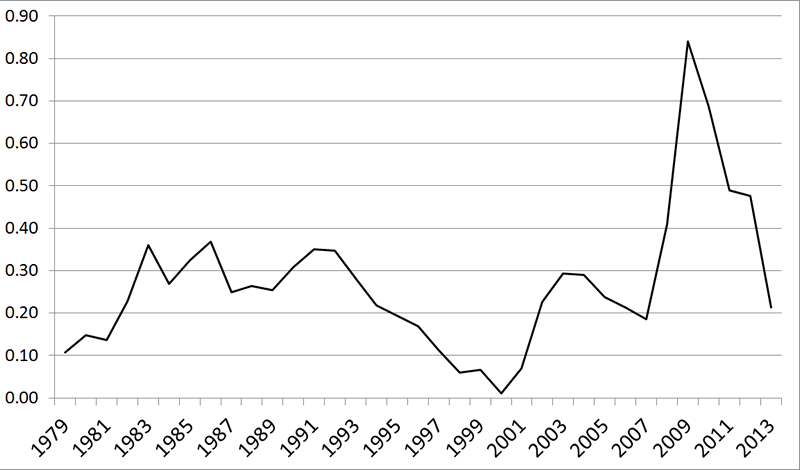
Figure 1: Net federal government borrowing as a percentage of federal tax revenue (percent). Source: St. Louis Federal Reserve Economic Data
In figure 1 we can see that not only does the federal government often finance itself with debt, but it does so by borrowing a lot relative to its income. In 2009 it borrowed 85 percent as much as it was able to raise through taxes! While commentators praise the government for getting its budget deficits under control and down to a more “reasonable” level of 4 percent of GDP, we can see that it still needs to borrow more than 20 percent of its income to keep its operations afloat.
Of course, this is just the yearly deficit. Turning our attention to the cumulative effects of this in terms of the gross federal debt outstanding we can see that the situation is even more precarious.
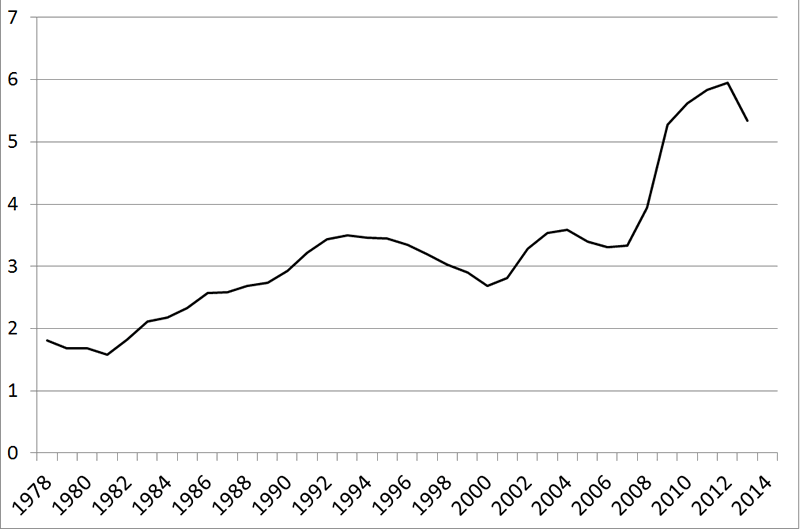
Figure 2: Gross federal debt as a percentage of federal tax revenue (percent). Source: St. Louis Federal Reserve Economic Data
As of last year, the gross amount of debt owed by the federal government was about 5.5 times its tax receipts. That would be equivalent to someone earning $30,000 a year owing $165,000. Somehow people are up in arms about students graduating with an average of $30,000 in debt and landing a measly $30,000 a year job, but few want to face the realization that the federal government is in five times worse shape.
The federal government is in worse financial state than is commonly recognized, but few would call it a subprime debtor, right? Let’s look at the type of borrowing the government does and you can make up your own mind.
Many subprime borrowers were caught when they borrowed for short periods only to see their interest charges increase when their adjustable rate mortgages reset higher.
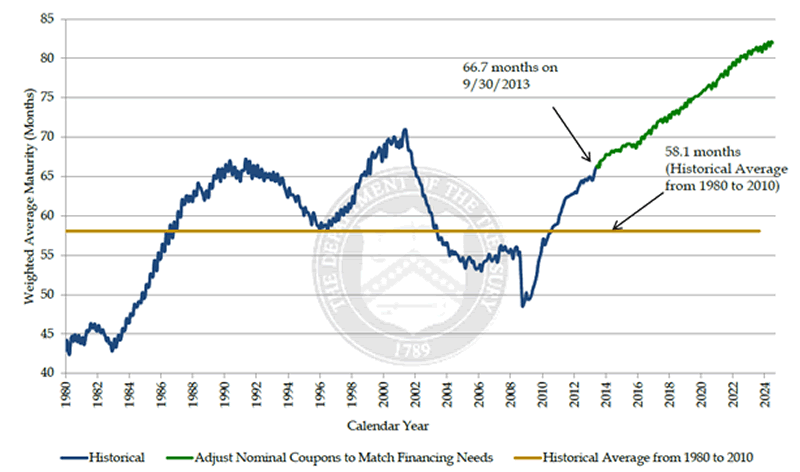
Figure 3: Weighted average maturity of federal debt outstanding (months). Source:United States Treasury Department
In figure 3 we can see that the average maturity of debt was about 5.5 years as of last year. Nearly half of its outstanding debt is due within three years, and a full two-thirds needs to be repaid within five. This may not be as short-term as some other debtors, but it’s not exactly a fixed rate mortgage either. On the other hand, it is troubling because the Federal Reserve has dedicated itself explicitly to a policy of fostering higher inflation. Accompanying this higher inflation will be increased interest rates, and a new problem for the government to “solve” as it is forced to borrow at higher interest rates.
What about interest-only, or negative-amortization loans? As we can see in figure 4, for the last decade (at least) the Treasury has underpaid its annual interest expense by about $200 billion per year. Last year that amounted to about 5 percent of its total tax receipts. This amount is added to the principal outstanding each year to increase the gross level of indebtedness of the federal government.
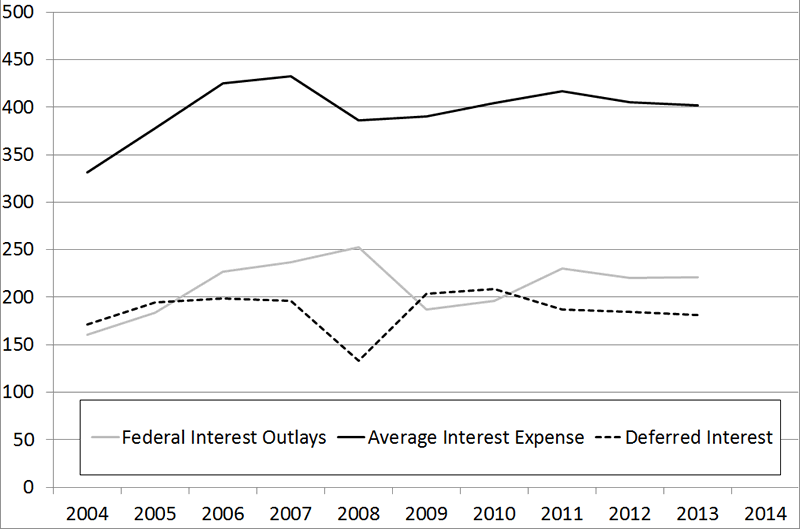
Figure 4: Federal Interest Expense and Payments ($bn.) Source: St. Louis Federal Reserve Economic Data and United States Department of the Treasury
Of course, this is not a strict example of a negative amortization loan. However, it has the same effect in the end, with the only difference being that the Treasury borrows money each year and incurs more interest in order to pay off the interest on its existing debt.
The United States government not only borrows in the same way that those destabilizing subprime lenders did six years ago, it does so on a much larger scale. Back in 2008, there were almost $15 trillion of mortgages outstanding (around 100 percent of 2008 US GDP). Many, if not most of these, were not subprime. By comparison, there is about $2 trillion more than this amount in federal debt today, the majority of which is repaid under conditions similar to those troublesome subprime borrowers. To make matters worse, since not all the nation’s income is the government’s, this amounts to more than 5.5 times the relevant tax base that it can repay it with. (Of course, unlike subprime borrowers who lost their jobs and income during the recession, the federal government can unilaterally increase its income by raising or introducing new taxes. I don’t think many want to see this option pursued.)
I will end by answering a troubling question: who lends this money to the federal government? After all, if the federal government’s “subprime” borrowing debacle goes down like the private one did six short years ago, it would be nice to know who to point the finger at. Banks and other financial institutions received the lion’s share of the blame for their part in so-called predatory lending of money to those who couldn’t repay, but who is lending to the government?
Lots of “little people” own a few T-bills, but they pale in comparison to the Federal Reserve.
Before the crisis, the Fed kept its Treasury purchases fairly steady and low relative to the total issuance (around 6-7 percent until 2007). Despite some early shedding of Treasuries early in the crisis in lieu of lower quality mortgage-backed securities and federal agency debt (something Philipp Bagus and I called “qualitative easing” at the time, seehere(pdf) andhere(pdf) and here), by 2010 over half of all Treasury debt was bought by the Fed. Even today, while talk of tapering QE abounds, the Fed is still responsible for over 40 percent of the federal government debt.
The federal government’s finances were not always so shoddy. While it is convenient to blame Congress for the present situation, it takes two to tango. The will to spend was apparent in the government, but the Fed provided the means.
Six years ago financial institutions were demonized as subprime borrowers who could not repay their loans. If the federal government turns out to be just another subprime debtor, we should expect the blame to be placed on the Federal Reserve for fostering such a situation and allowing it to persist for so long.
David Howden is a PhD candidate at the Universidad Rey Juan Carlos, in Madrid, and winner of the Mises Institute's Douglas E. French Prize. Send him mail. See his article archives. Comment on the blog.![]()
© 2014 Copyright Ludwig von Mises - All Rights Reserved Disclaimer: The above is a matter of opinion provided for general information purposes only and is not intended as investment advice. Information and analysis above are derived from sources and utilising methods believed to be reliable, but we cannot accept responsibility for any losses you may incur as a result of this analysis. Individuals should consult with their personal financial advisors.
© 2005-2022 http://www.MarketOracle.co.uk - The Market Oracle is a FREE Daily Financial Markets Analysis & Forecasting online publication.