UK Unemployment Plunge Conservative Election Boost
Economics / Unemployment Feb 19, 2015 - 12:21 PM GMTBy: Nadeem_Walayat
 UK unemployment falls to its lowest level for 6 years as statistics for the 3 months to December 2014 register a drop of 97,000 claimants to 1.86 million, standing at 5.7% of the workforce, and down nearly 1/2 million on a year ago that illustrates a continuing strong trend in the reduction of domestic unemployment that is set against approx 700,000 jobs created. The difference being that these jobs have gone to migrant workers from firstly Eastern Europe and then the bankrupting PIIGS nations with Spain, Portugal and Greece that have lost many of their brightest to the likes of Britain's NHS, so if your puzzled by the origins of your accented NHS consultant then you may find that they are probably Greek.
Falling unemployment puts upwards pressure on wages that are now rising at 2.1% per annum, well above both official rates of inflation at CPI 0.3% and RPI 1.6%, perfectly times to coincide with the run up to the General election that follows sub-inflation or even falling wages for the past 5 years.
My long standing forecast as of 4.5 years ago was for UK unemployment to trend higher towards a peak of 2.9 million by mid 2013 before trending lower into the May 2015 general election as I expected 70% of the new jobs created under the Coalition government to go to migrant workers as they continued to displace British workers.
01 Jul 2010 - UK Unemployment Forecast 2010 to 2015
Final conclusion - UK unemployment looks set to gradually rise to a peak of just over 2.9 million by mid 2013 before stabilising and starting to decline into a May 2015 General Election of just below 2.7 million against the governments forecast for UK unemployment to fall to 2 million by 2015 (OFBR - Peak at 8.1% this year before falling to 6.1%).
The benefit claimant count can also be expected to rise, though is much more difficult to forecast as it is far easier for the government to manage claimant numbers by moving recipients onto other benefits, OFBR forecast a claimant count of 1.17 million by May 2015.
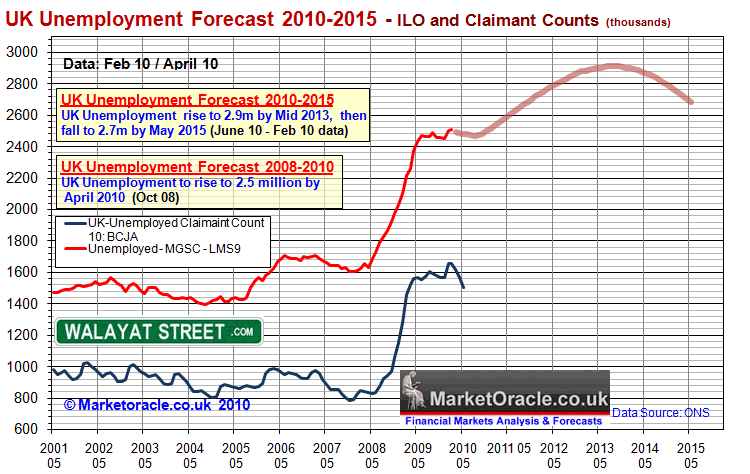
The following updated graph illustrates what has subsequently transpired in that UK unemployment did track my forecast for the first two years before starting to show significant divergence that on face value was a sign of relative economic strength but instead reflects the dual impact of the Coalition government stealthy abandoning the policies of economic austerity as evidenced by expansion of the budget deficit against forecast expectations. Something that both Labour and the Coalition government were happy to under play the significance of as both parties are invested in promoting the impacts of economic austerity. That and the trend for falling wages which encouraged employers to retain / employ workers on significantly less pay.
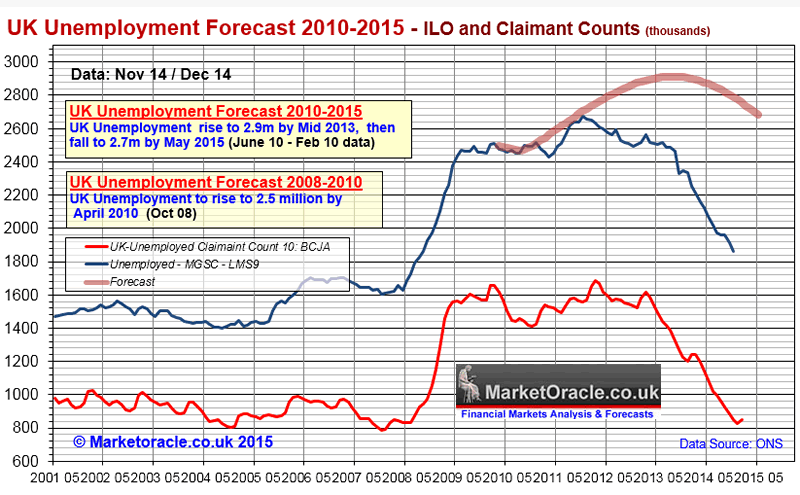
The positive UK unemployment trend has been further encouraged through a whole host of schemes such as the Bank of England's funding for lending scheme primarily for small businesses, full time workers converted to part time workers, and 1.1 million more self employed than there were in 2008, and that more than 1.2 million workers are now contracted under zero hours (up from 150,000 in 2010) that amount to a pools of virtual slave labour, workers who tend not to know if they will be working the following day until they receive a phone all or more usually the case a text message the evening before, and even then may find themselves rejected on arrival at work if the quota for workers has been fulfilled for that days shift work, or that their shift will end early on completion of the order, hence less pay as workers are only paid for hours actually worked.
Real Unemployment is 5.5 Million
Whilst the headline UK Unemployment rate peak of 2.7 million at 8.5% of the workforce is remarkably low when one compares it against past milder recessions had seen UK unemployment peak at much higher levels i.e. in the 1980's at 12% and in 1990 at 10.8%, therefore on face value the Labour government and then Coalition appeared to have achieved a minor miracle by UK unemployment peaking at only 8.5% amidst the worst recession since the Great Depression, which in reality was an 6 year economic depression.
However, I have long questioned the accuracy and validity of the official unemployment data which over several decades and much manipulation by successive governments has been tweaked many hundreds of times to under report true unemployment for political purposes. Current official unemployment stands at 1.86 million which is set against the total recorded as economically inactive of working age that stands at over 9 million which illustrates the true extent of failure of the last Labour government to manage the potential of the work force during the boom years as illustrated by the fact that 80% of the 2.1 million jobs created under Labour went to foreign workers and therefore did nothing to address the true level of UK unemployment that contained a hidden ticking social security financing time bomb that we have seen explode as an extra £40 billion annual budget deficit.
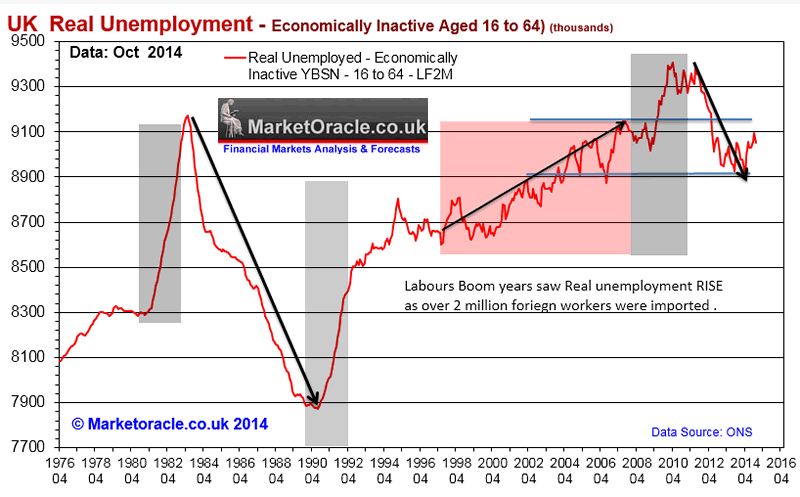
During the Conservative boom cycle, real unemployment fell from the 1983 crisis peak. However the same did not take place following the early 1990's recession where real unemployment failed to not only fall but steadily rose under Labours boom years as the benefits culture took hold as over 1 million foreign workers performed the jobs that unemployed Britain's were not prepared to do as they were far more comfortable living off tax payers as vested interests in Labours benefits for life culture, thus Labour engineered an extra 2 million positive voter balance i.e. 1 million more benefit claimants coupled with 1 million low paid immigrant workers that continued to increase long after the boom had ended.
Whilst not all of the 9 million economically inactive are capable of seeking work, however the figure does imply that at least 4 million of the 9 million form the core of the what we all knows as the benefits culture i.e. the could work but won't work.
Therefore the 4 million not counted in official unemployment numbers that choose not to work but instead prefer to rely on tax payer funded benefits added to the official 1.86 million unemployed results in a total UK unemployment count of 5.9 million. Which is more in line with the recession experience of other similarly in-debted and structured European countries.
The Conservative led coalition has only been marginally successful in dismantling Labours benefits for life culture, as clearly the fall in real unemployment is nowhere on the scale of that which occurred following the early 1980's recession, when real unemployment was reduced by 1.2 million against just 300,000 during the past few years, implying that the Coalition has so far only done half the job of unraveling Labours pool of vested interest benefit claimants.
The key message that this graph sends out is that no matter what propaganda Labour politicians spout their actions in government are always to increase the number of real unemployed because most of whom would be expected to vote Labour just as took place during the Blair boom years.
Implications for General Election Result
Implications are for a further 100,000 reduction in headline unemployment number in the run up to election day and including effect of voting spouses, family members will likely result in at least 100,000 more predisposed to vote for the Conservatives, which whilst not a huge number of voters nevertheless will be enough to tip a handful of marginal seats in the conservatives favour, and further illustrates in microcosm what is taking place right across Britain in terms of improving economic activity such as wage inflation, which means that today's opinion polls that tend to put the Tories and Labour near neck and neck on about 280 MP's each are UNDER estimating the eventual number of seats that the Conservatives will succeed in winning, where the question is by how many seats which I will seek to answer in my next election analysis so ensure you are subscribed to my always free newsletter from my next in-depth analysis and detailed forecast in your email box.
In the meantime see my existing long standing forecast conclusion as of December 2013.
16 Dec 2013 - UK General Election Forecast 2015, Who Will Win, Coalition, Conservative or Labour?
The following graph attempts to fine tune the outcome of the next general election by utilising the more conservative current house prices momentum of 8.5% which has many implications for strategies that political parties may be entertaining to skew the election results in their favour.
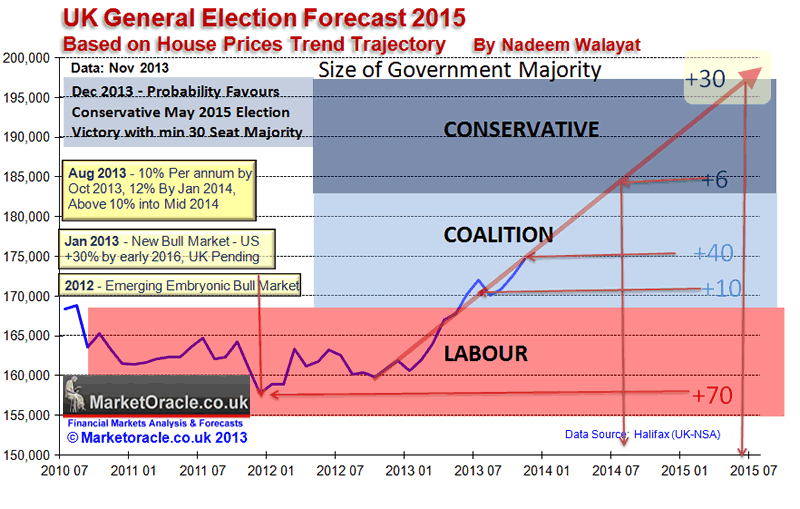
The the key implications of the above graph are -
- The window for an outright labour election victory has ended as of July 2013.
- As of writing an election today would result in a Coalition government with a majority of about 40 seats.
- The window of opportunity for a Coalition government ends by mid 2014 after which there is an increasing probability for a Conservative outright majority.
- A May 2015 general election at an average house price inflation rate of 8.5% would result in a Conservative overall majority of about 30 seats. Therefore this is my minimum expectation as I expect UK house prices to start to average 10% per annum from the beginning of 2014.
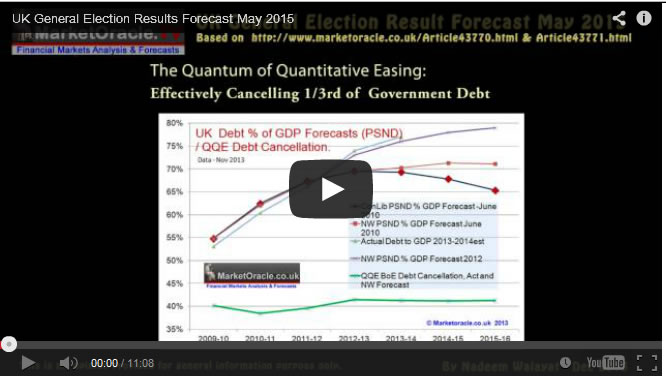
And also a video version of the analysis and forecast conclusion -
Source and Comments: http://www.marketoracle.co.uk/Article49497.html
By Nadeem Walayat
Copyright © 2005-2015 Marketoracle.co.uk (Market Oracle Ltd). All rights reserved.
Nadeem Walayat has over 25 years experience of trading derivatives, portfolio management and analysing the financial markets, including one of few who both anticipated and Beat the 1987 Crash. Nadeem's forward looking analysis focuses on UK inflation, economy, interest rates and housing market. He is the author of five ebook's in the The Inflation Mega-Trend and Stocks Stealth Bull Market series that can be downloaded for Free.
 Nadeem is the Editor of The Market Oracle, a FREE Daily Financial Markets Analysis & Forecasting online publication that presents in-depth analysis from over 1000 experienced analysts on a range of views of the probable direction of the financial markets, thus enabling our readers to arrive at an informed opinion on future market direction. http://www.marketoracle.co.uk
Disclaimer: The above is a matter of opinion provided for general information purposes only and is not intended as investment advice. Information and analysis above are derived from sources and utilising methods believed to be reliable, but we cannot accept responsibility for any trading losses you may incur as a result of this analysis. Individuals should consult with their personal financial advisors before engaging in any trading activities.
Nadeem Walayat Archive |
© 2005-2022 http://www.MarketOracle.co.uk - The Market Oracle is a FREE Daily Financial Markets Analysis & Forecasting online publication.


