


Three Hidden Forces Pushing Crude Oil Price Back Up
Commodities / Crude Oil May 20, 2015 - 12:37 PM GMTBy: ...

MoneyMorning.com  Dr. Kent Moors writes: The overall trajectory for oil prices remains upward, despite taking a breather today. I still see prices reaching $65-68 for West Texas Intermediate (WTI, the benchmark traded on the NYMEX) and $73-78 for Dated Brent (the other major benchmark set daily in London).
But this is hardly going to be a straight, linear rise. Rather, it’s going to occur in what I call a “ratcheting” pattern: occasionally jerking downward along the way.
One of the primary concerns causing some of the sudden drops in oil prices is the impact of excess production.
The traditional belief has been that downward prices discourage forward commitments of capital expenditures, thereby reducing supply and more closely associating prices with demand.
Operating companies have been slashing the financing of new wells, and the number of rigs in the field are now down to levels not seen since the credit crunch. So we should have seen a corresponding drop in production.
That’s not what happened.
Just take a look at this chart…
Production Has Risen, but Not for Long
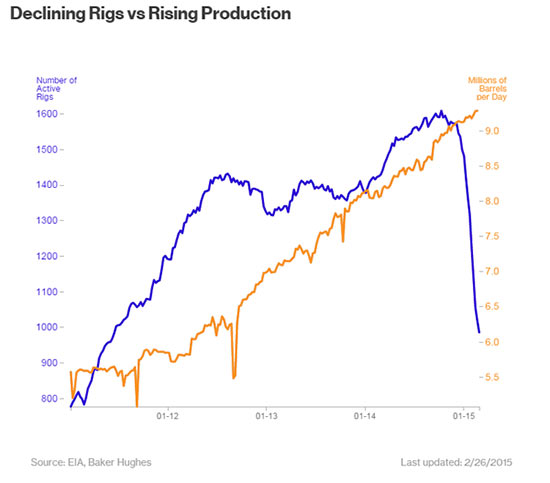
The explanation for this phenomenon lies in the ending production from the newest wells drilled. The rise in oil volume has come from those wells brought on line over the past year and a half. Advancing technology and the number of wells per pad have brought in far more oil than expected.
Now, as we have previously noted, this production will begin to taper off mid-summer. Primary extraction levels from these shale/tight oil wells occur in the first 18 months on average, with a marked decline then taking place.
However, another factor is in play here. There was a counterintuitive move to maintain production during the period of low oil prices because companies were seeing the rise in prices comping and wanted to stockpile crude in advance of the price improvement.
That trend is now drawing to a close. And that makes the current quoted price (and the move up) more representative of what is actually happening. Supply is once again moving more in tandem with demand.
Strip Prices Are in a Classic Contango
There are three pictures to view in this regard.
The first involves the New York Mercantile Exchange (NYMEX) crude strip and contango.
Futures contracts on oil are entered throughout the day for delivery from one month to several years out. At any given time, the NYMEX crude strip provides us with a very nice snapshot of what the futures curve looks like.
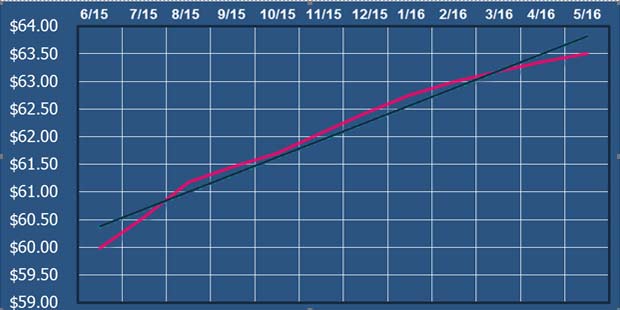
Below are the one-year strip prices at close last Friday. The red line is the pricing for each one-month contract increment, while the black line is the trend. Notice this is a classic contango – that is, each month’s price is higher than the month(s) preceding.
Looking as this, companies assume the price is rising moving forward. Remember, each of these monthly prices represents the average of contracts. The actual market price, therefore, is expected to be higher.
NYMEX ONE-YEAR OUT CRUDE STRIP FOR CLOSE ON 5/15/2015
Taken by itself, this might seem to add motivation for stockpiling more production, thereby accentuating the surplus and actually depressing the short-term price. But stockpiling makes sense only if there is a significant discrepancy between current and future prices. The strip prices, on the other hand, are moving in the other direction. They are constricting.
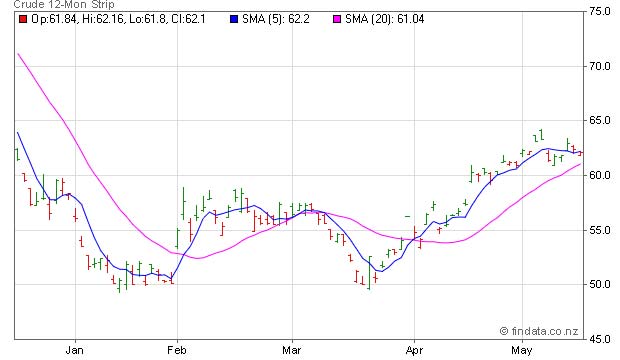
The End of New Surplus
That is today’s second point. The five- and 20-day moving averages of the 12-month strip rather dramatically illustrate an initial opportunity to improve return, followed by a converging of the indicators.
Third, as expected from this, we see in this final chart that crude storage rates are now closely tracking the 12-month WTI price.
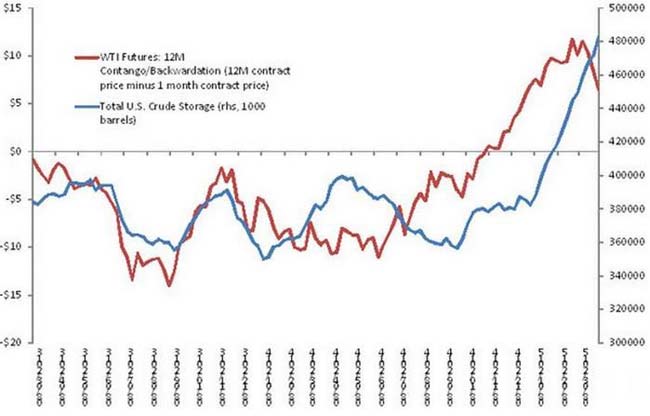
All of this leads to one basic conclusion. The talking heads on TV may still predict rising production. But absent a major correction in the market, there are declining profit-margin reasons to stockpile crude. There is still plenty of supply out there. We are unlikely to see massive new excess surplus coming on line to depress prices.
Source :http://oilandenergyinvestor.com/author/kmoors1/
Money Morning/The Money Map Report
©2015 Monument Street Publishing. All Rights Reserved. Protected by copyright laws of the United States and international treaties. Any reproduction, copying, or redistribution (electronic or otherwise, including on the world wide web), of content from this website, in whole or in part, is strictly prohibited without the express written permission of Monument Street Publishing. 105 West Monument Street, Baltimore MD 21201, Email: customerservice@moneymorning.com
Disclaimer: Nothing published by Money Morning should be considered personalized investment advice. Although our employees may answer your general customer service questions, they are not licensed under securities laws to address your particular investment situation. No communication by our employees to you should be deemed as personalized investent advice. We expressly forbid our writers from having a financial interest in any security recommended to our readers. All of our employees and agents must wait 24 hours after on-line publication, or after the mailing of printed-only publication prior to following an initial recommendation. Any investments recommended by Money Morning should be made only after consulting with your investment advisor and only after reviewing the prospectus or financial statements of the company.
© 2005-2022 http://www.MarketOracle.co.uk - The Market Oracle is a FREE Daily Financial Markets Analysis & Forecasting online publication.