


Gold Remains Weak In This Disinflationary Environment
Commodities / Gold and Silver 2016 Jan 26, 2016 - 06:47 AM GMTBy: InvestingHaven

 Gold is struggling. Gold bulls will tell you that the yellow metal is doing great, as it has gone up since the start of the year, while stocks and most other commodities have come down. That is obviously only part of the story. As fear among investors has exploded in recent weeks, one would expect gold’s fear trade character to manifest itself. So far, the fear trade has been contained.
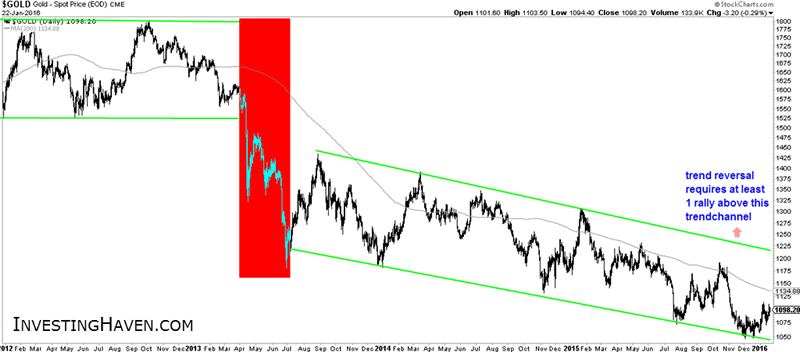
Gold’s trend is still down, until proven otherwise. Our chart tells a clear story: after a consolidation period in 2012 and a trend change (see in red on the chart below), gold has been moving in a clear trend channel. Since last January, the yellow metal has failed to even test its resistance line.
So the question really is what we can derive from the leading indicators in the precious metals complex.
One of the indicators, according to our methodology, is the futures market structure, particularly the short positions of commercial traders. In order to understand the underlying dynamics, we use an analogy: the faster commercial net short positions increase, the more stopping power they create to cap a rally. In that context, one can clearly see in the lower pane of the next chart how commercial traders are capping rallies as every time gold’s price nears resistance (since 2012). Readers can do the exercise by comparing the peaks since 2013 on the chart above, and see how that coincides with peaks in net short positions of commercial traders on the chart below (blue bars, lower pane).
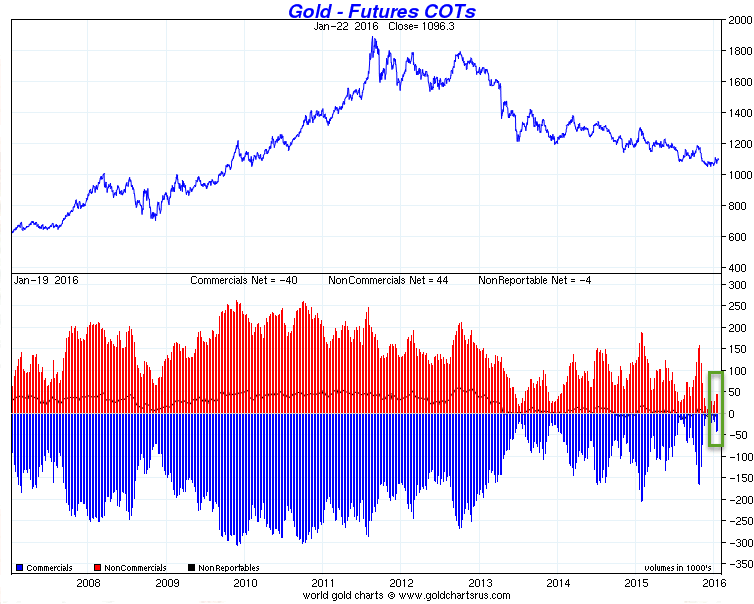
Today’s futures positions are still relatively low, and the rate of change is low as well, as indicated with the green rectangle. We interpret this as ‘there is sufficient upside potential’ but probably within the boundaries of the downtrend. We will not get excited about gold until it proves able to break out of its trend channel.
One sidenote: it could be an encouraging sign for gold bulls that commercial traders need increasingly more stopping power (read: higher short positions) to cap the rallies, a trend started in the summer of 2013. We don’t read too much in that trend, at least not yet, but we keep a close eye on it.
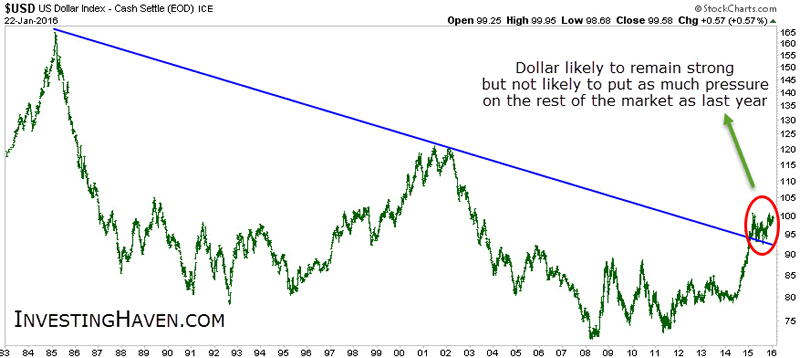
It is hard to imagine that gold could perform well after such a huge performance of the U.S. dollar. It is no understatement to say that the dollar has recently confirmed its secular breakout. Since August of 2014, the dollar has put enormous pressure on markets, and, particularly, crude oil, after a monster rally of 30% in less than a year. That has only happened before in 1997, and we know from that time period that pressure eased after the dollar’s first leg up. If history is any guide, we will see a continuation of the bull market in the U.S. dollar but with less pressure on other segments on the market.
A strong dollar, however, is deflationary (or disinflationary at best). And this is a key concern for precious metals. Low inflation expectations are THE key driver for precious metals, period.
The head of the European and U.S. central banks are struggling with ‘their inflation target’. The Financial Times wrote earlier this month that the ECB has missed its inflation policy target of 2 pct for four consecutive years. “The target has lost credibility. Once people have lost confidence in an inflation target, it becomes very hard for the central bank to persuade them to trust the target again.”
Mrs. Yellen has also difficulties achieving the 2 pct inflation rate, a key objective of U.S. monetary policy. Bloomberg notes that the inflation rate could have risen with 11 pct year-on-year (which is a relative increase), but “the latest advance will curb already slowing economic growth and put downward pressure on an inflation rate that the Fed judges is too low as it is.”
For clarity, we are not saying that we agree with any of these objectives, or policies. We are simply looking for leading indicators for the precious metals complex, and inflation expectations is known to be one of them.
A third indicator is the gold mining sector. Gold miners are consolidating around their lows since last summer. The charts of gold mining indexes like the HUI or GDX are so boring we even do not include them here. The message from the gold mining sector is one of weakness, even with a crashing crude oil price (one of the key input costs for mines).
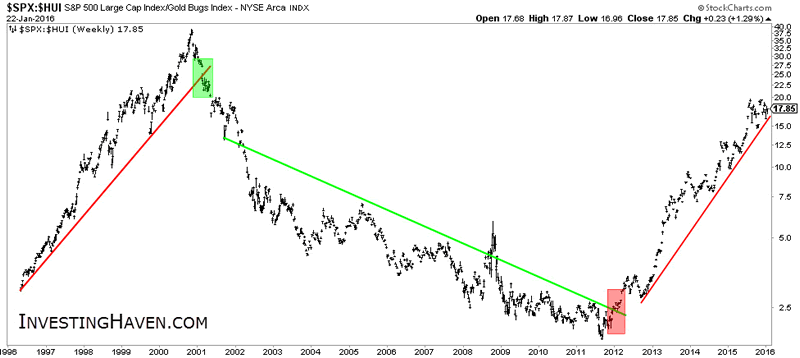
A chart worth including, however, is the stocks to gold miners ratio, not only because intermarket dynamics are a fundamental aspect in our methodology, but also because stocks have been weak in recent months. Even in that context the ratio has not been able to reverse its trend, as seen on the next chart. In our own words: gold miners confirm what the other indicators are telegraphing.
CONCLUSION:
Gold remains weak, and its leading indicators do not signal any strength. We closely watch the rate of change of net shorts position of commercial traders, as well as strength in the U.S. dollar (read: disinflationary pressure). Gold miners should rise sharply with a break out of gold’s trend channel, before even thinking of a trend reversal.
Analyst Team
The team has +15 years of experience in global markets. Their methodology is unique and effective, yet easy to understand; it is based on chart analysis combined with intermarket / fundamental / sentiment analysis. The work of the team appeared on major financial outlets like FinancialSense, SeekingAlpha, MarketWatch, ...
Copyright © 2016 Investing Haven - All Rights Reserved Disclaimer: The above is a matter of opinion provided for general information purposes only and is not intended as investment advice. Information and analysis above are derived from sources and utilising methods believed to be reliable, but we cannot accept responsibility for any losses you may incur as a result of this analysis. Individuals should consult with their personal financial advisors.
© 2005-2022 http://www.MarketOracle.co.uk - The Market Oracle is a FREE Daily Financial Markets Analysis & Forecasting online publication.