


Dow Jones Complacency Hits New Heights
Stock-Markets / Stock Markets 2016 Apr 07, 2016 - 01:54 PM GMTBy: AnyOption

 What a difference two months can make as evidenced by the rapid rebound in the Dow Jones Industrial Average. A quick look at one of the most commonly quoted American equity benchmarks shows a remarkable rally over the past two months. However, fundamentally, nothing is different now than two months ago. In fact, the increasingly hawkish commentary of the Federal Reserve and potential rate hikes in the first and second half of the year could spell the beginning of a new round of asset reallocation as the upside benefits are negated by the potential downside risks. Chasing after this latest rally higher in equities may not be wise considering the growing risks not only to the economic outlook, but additionally from the revenue recession currently sweeping across publicly traded American companies.
Fundamentally Speaking
While the impetus for much of the recent gains in equities has been the ongoing accommodative efforts undertaken by several global institutions including the European Central Bank and Bank of Japan, these activities are testing the limits of monetary policy. Already, many of these actions have proven ineffective at staving off deflation and improving spending dynamics. In the United States, the move to tighten and normalize policy while challenging, is still moving forward. Fed funds futures currently show a rising probability that the Federal Reserve will opt to raise rates once if not twice by the end of 2016. This could add to dollar momentum to the upside, making US equities more expensive by comparison to foreign peers. Additionally, it could lead to a massive reallocation of investment capital away from higher yielding equities to more risk-averse assets such as bonds.
From the bigger picture level of the economy, US performance continues to struggle due to a host of reasons. Caution from the Central Bank in particular is worth noting alongside the uptick in the unemployment rate to 5.00%. While job creation remains positive, it is important to remember that labor force participation remains near multi-decade lows and shows few signs of improving over the medium-term, creating additional slack. Manufacturing and the export economy are also taking a hit thanks to weakness in the energy patch and the high valuation of the US dollar. Companies that are especially sensitive to the export economy have been hit hard, with Dow component Boeing recording a -16.60% performance over the last 52-weeks while Caterpillar has slumped by -6.58% over the same time period. The placeholder for the worst performance however is held by American Express which has tumbled by -23.16% over the last year.
However, the terrible performance of Goldman Sachs is worth highlighting due to the fact that it holds the second highest weighting in the index at 6.04%, with only 3M having a larger weighting. Even though the technology sector has notched a mixed performance over the last year, one of the major outperformers among index constituents is Microsoft which has climbed by 31.37%, only outshined by the 32.21% gain in McDonald’s shares. Generally speaking though, it is important to underline that public companies across the board are struggling to raise revenues at a time when global economic growth is rapidly decelerating and in some cases such as trade, even contracting. The Dow Jones does provide some incentive for income investors thanks to the 2.57% dividend yield for the aggregate index, but a price-to-earnings rate of 17.99 indicates the index does has some room to correct further to the downside.
Technically Speaking
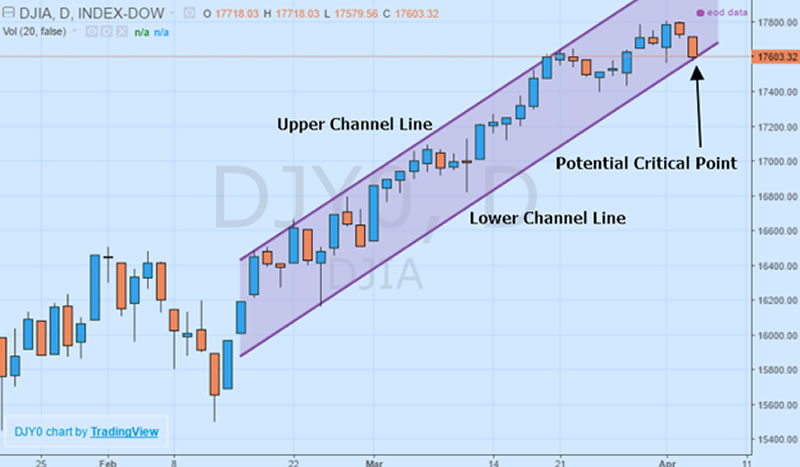
The Dow Jones Industrial Average has recorded a spectacular comeback after plunging to February lows. The turnaround in the index saw prices rise 14.88% from February 11th through April 1st, a substantial turnaround especially as investors grow wary of the remaining potential upside in the index. Although the current price action and emergence of an equidistant channel formation may mark a great potential entry point considering the current uptrend, it equally carries a number of risks. From the perspective of the channel, the Dow Jones at the bottom of the range may be the ideal place to establish positions targeting the upper channel line. However, a candlestick close below the lower channel line could be the catalyst that see a downside breakout in the benchmark. Should this occur, it could signal a major shift in momentum for the Dow Jones and potentially be the beginning of another test of February lows.
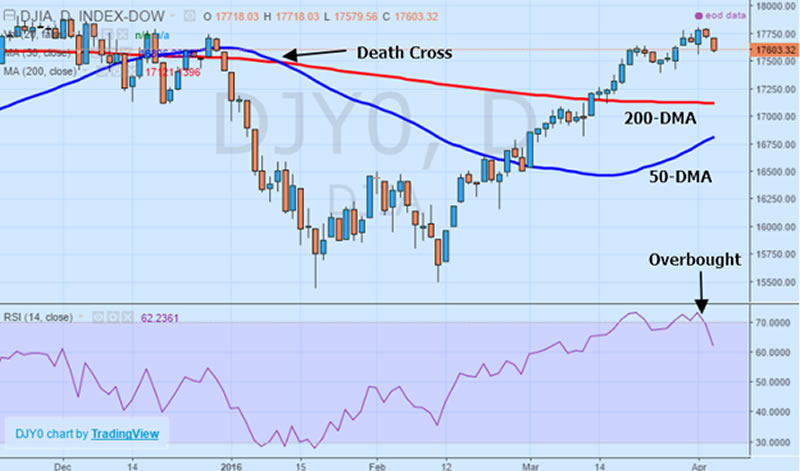
Even though the equidistant channel exhibits a strongly bullish bias, in conjunction with the medium and longer-term moving averages, the upside case is stronger for the index. While the 50-day and 200-day moving averages are currently trending below the price action and starting to act as support levels for further upside, the “death cross” formation that catalyzed back in early January has a notorious bearish bias, especially after both moving averages were trending lower with the 50-day crossing over to the downside. Even though the 50-day moving average is now trending higher and the slope of the 200-day moving average is nearly flat, this does not necessarily indicate that the uptrend will persist. With the relative strength index recently climbing above the 70 level and now retreating, the Dow Jones Industrial Average remains heavily overbought and could very well test the strength of support provided by the moving averages.
While the Dow Jones Industrial Average might not yet have completely exhausted its upward momentum, there are a number of risk factors that threaten to derail any further upside. Numerous indicators are suggesting that the benchmark equity index is slightly overbought and additionally, economic data implies a shift in underlying fundamentals that could foreshadow an impending recession. Since equities are typically a leading indicator, confirmation could come in the form of another tumble in the index. Investors betting on another round of gains should understand that the risks of trying to capture an additional 3-5% of upside near-term could potentially include 15-20% downside over the medium-term.
Anyoption™ is the world's leading binary options trading platform. Founded in 2008, anyoption was the first financial trading platform that made it possible for anyone to invest and profit from the global stock market through trading binary options.
Our goal here at Market Oracle is to provide readers with valued insights and opinions on market events and the stories that surround them.
Website anyoption.com
© 2016 Copyright Anyoption - All Rights Reserved
Disclaimer: The above is a matter of opinion provided for general information purposes only and is not intended as investment advice. Information and analysis above are derived from sources and utilising methods believed to be reliable, but we cannot accept responsibility for any losses you may incur as a result of this analysis. Individuals should consult with their personal financial advisors.
© 2005-2022 http://www.MarketOracle.co.uk - The Market Oracle is a FREE Daily Financial Markets Analysis & Forecasting online publication.