


EURJPY Formed A Double Top Pattern On 4-hour Chart
Currencies / Euro Nov 01, 2017 - 12:45 PM GMTBy: Franco_Shao

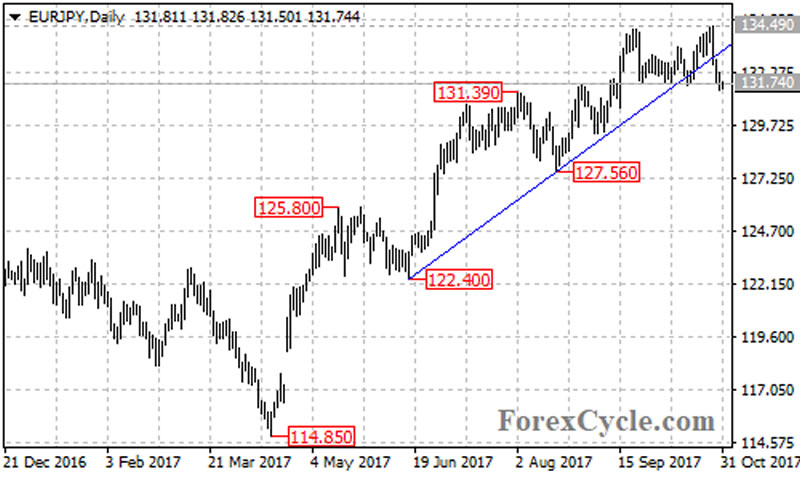
 EURJPY moved below a major bullish trend line from 122.40 to 127.56 on its daily chart, suggesting that the upside movement from 114.85 had completed at 134.49 already. Further decline would likely be seen in the coming days.
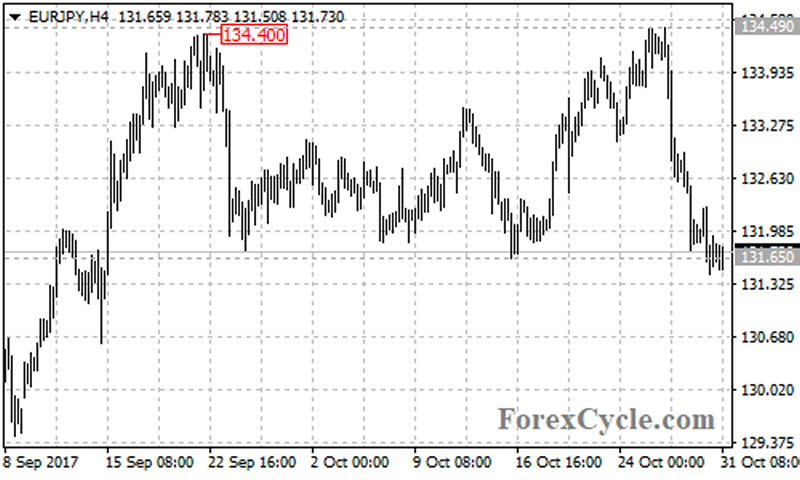
On the 4-hour chart, the EURJPY pair formed a double top pattern with neckline at 131.65. The price just broke below the neckline support, confirming a 300 pips potential drop down is underway. The pair is expected to test 129.36 support, followed by 127.56. Breakthrough these levels could take price to next support level at 122.40, which is the 61.8% Fibonacci retracement taken from 114.85 to 134.49.
Below 122.40 support could trigger another fall towards an important support trend line from 109.04 to 114.85 on the weekly chart, now at around 118.60. Strong rebound could be expected after touching this trend line support.
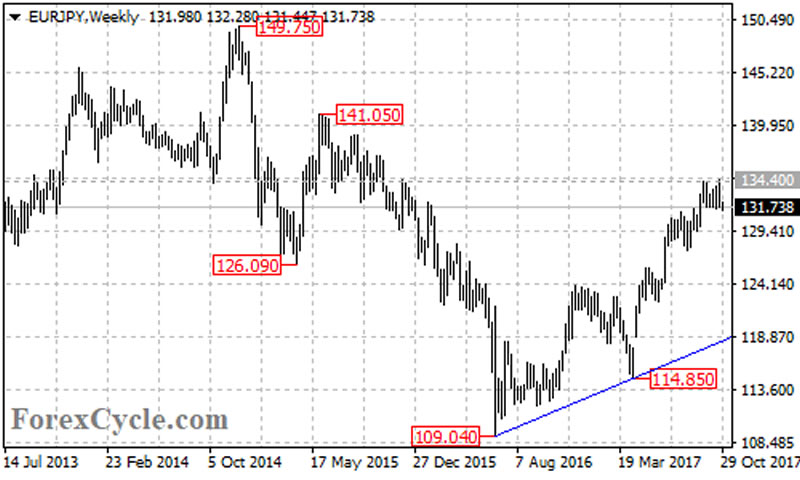
Near term resistance is at 132.90, only break above this level could trigger another rise towards 134.50. Above this level could signal resumption of the uptrend from 114.85, then next target would be at the 76.4% Fibonacci retracement taken from 149.75 to 109.04 at around 140.00.
Technical levels
Support levels: 129.36 (the September 6 low), 127.56 (the August 18 low), 122.40 (the June 15 low), 118.60 (the bullish trend line on the weekly chart), 114.85 (the April 17 low).
Resistance levels: 132.90 (near term resistance), 134.49 (the October 25 high), 140.00 (the 76.4% Fibonacci retracement), 141.05 (the June 2015 high), 149.75 (the December 2014 high).
This article is written by Franco Shao, a senior analyst at ForexCycle.
© 2017 Copyright Franco Shao - All Rights Reserved Disclaimer: The above is a matter of opinion provided for general information purposes only and is not intended as investment advice. Information and analysis above are derived from sources and utilising methods believed to be reliable, but we cannot accept responsibility for any losses you may incur as a result of this analysis. Individuals should consult with their personal financial advisors.
© 2005-2022 http://www.MarketOracle.co.uk - The Market Oracle is a FREE Daily Financial Markets Analysis & Forecasting online publication.