


Stock Traders Must Stay Optimistically Cautious II
Stock-Markets / Stock Markets 2019 Feb 22, 2019 - 12:36 PM GMTBy: Chris_Vermeulen

 This Part II of our research post regarding the future potential of any very deep market correction and/or a potential new-age market rally based on our presumption that the global market dynamics have changed dramatically over the past 20+ years. Are the market gurus correct in thinking the next big move will be to the downside? Or are they missing key aspects of the global market dynamics that point to a massive upside rally that is setting up for the future. Today, we continue to explore some of the key elements that we believe present a total scope of the potential for the global markets.
In Part I of this article, we highlighted how globalization changed the planet and increased inter-dependence across the globe for economies and governments. The point we wanted to make from the first segment was to highlight the fact that the current world economies are vastly different than the global economy prior to 1980 or 1970. Over the past 20+ years, the world’s economies have become more and more connected and interdependent on one another. Additionally, global investors and financial institutions have become heavily interconnected and reliant on the global market economies of the world. The reality is, the world is vastly different than it was 40+ years ago in terms of finance, banking, and investment objectives.
Today lets focus on the world’s central banks and their partners – the global banking/finance enterprises. Something very interesting has taken place over the past 20 years. The world’s central banks have avoided crisis and controversy by pouring over $20 Trillion
The wealth and capital that has been created over the past 50 years have acted in multiple means to drive social, economic and human improvement over time. Please take a moment to consider in 1970, the total World Per Capita GDP was $802.123. In 2017 the total World Per Capita GDP was $10,721.609 – this represents a massive 1337% increase over the past 50 years or a total of 26% annually over this span of time.
As the total global debt rose, the amount of capital that entered the markets also rose. At a time when the capital investment was somewhat isolated (in the 1970s), a boom of globalization and cross-nation industrialization/manufacturing created a massive amount of wealth and opportunity for people around the globe. This resulted in a massive 26% average annual increase in global GDP since 1970.
Additionally, the US has been a major driving force in the creation of this new wealth and prosperity. Throughout the late 1980s and 1990s, an incredible new technology launched globalization across almost all nations and increased the ability for all nations to enact new enterprises and commerce in a way that was never even imagined before – the Internet. We will show charts that support our points that Per Capita output rose dramatically throughout this time frame with very little central bank support.
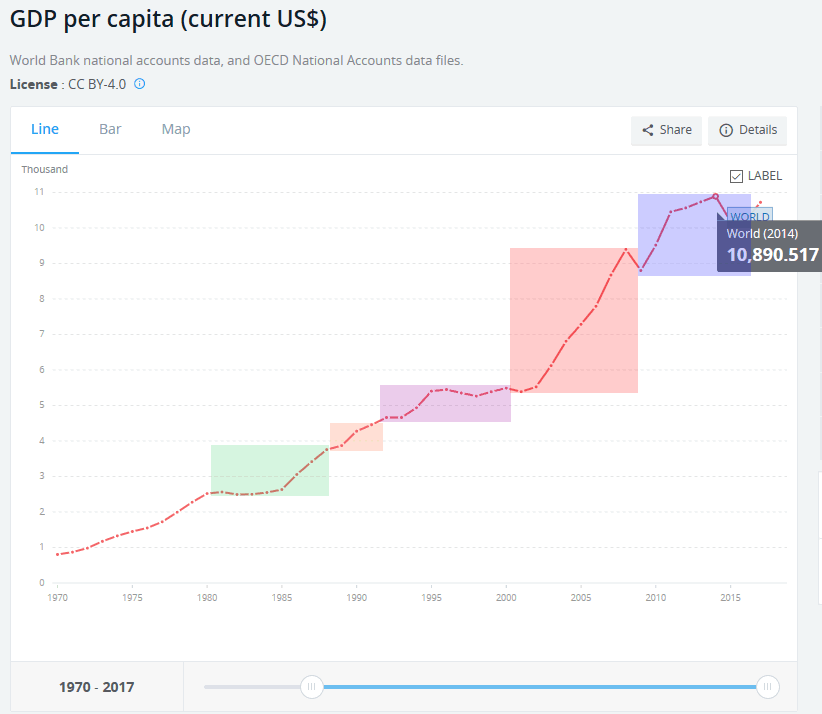
(Source : https://data.worldbank.org/indicator/NY.GDP.PCAP.CD?end=2017&start=1970)
Consider this very important fact regarding the incredible growth of global GDP; after the year 2000, total global capitalization more than DOUBLED over the past 19 years. Yes, that is correct, the amount of capital within the world right now is more than double the total global capitalization that was accumulated over the past 250+ years. The world entered a period where the September 11 attack on the US disrupted the global markets with such force, that a massive amount of capital was deployed to offset the global risks. Again, the 2008-09 global credit crisis created another massive risk event where even more capital was deployed throughout the planet to support the global banking markets and to support institutional infrastructure that allows for continued global growth.
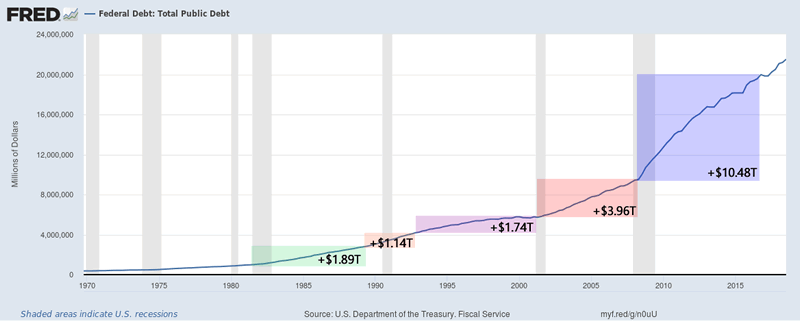
Now, let’s compare this GDP growth to the actual US Federal Reserve total debt. We find it interesting that massive amounts of recent debt have yet to really create any recent massive increases in GDP output. We believe this is a result of a “restructuring” process throughout the global economy following the 2009 through 2014 global market recovery process. In other words, the total global economies have yet to begin firing on all cylinders again and, after a sufficient period of “restructuring”, we believe the global economies will begin to re-sync with renewed optimism and opportunity. Think of this “re-syncing event” as a global revaluation event where proper levels of valuations are attained before a new increase in global GDP output will resume.
The timing of the past 40+ years may have played an important role in providing for the recent GDP increases as well as the global credit market events that have resulted in massive central bank intervention. Our theory is that after the US Fed interest rate peak, near 1982, the continued globalization process (outsourcing of the US economy to other sources throughout the planet) resulted in a “reversion process” within the US that allowed for massive growth in foreign markets while revaluing the US markets to suitable levels and allowing for a transition process to take place across the globe.
This transition process is now mostly complete and the recent 2009~2014 credit crisis that recapitalized the planet with capital/cash has currently primed the global economic engine for a spark. The only thing we’re waiting on right now is for the global markets to settle the “revaluation phase” and latch onto some new technology or infrastructure project that will launch a new economic boom cycle. Within the past 20+ years, the US Fed has pumped nearly $16 Trillion dollars into the global economy (+300% compared to 1999 levels) and the Global GDP output levels have risen from roughly 5.5k to 10.9k (+200% compared to 1999 levels). Comparatively, from 1970 to 1999, the US Fed had pumped over $6 trillion into the global economy (over 450% from 1970 levels) and GDP rose from 0.8K to $5.5k over that same time (+680%). If our analysis is correct, global GDP should begin to increase dramatically and should target levels well above $15~18k within a 10~20 year span.
Let that sink in for a bit as we prepare for Part III of this research post.
If you want to join a group of professional traders, researchers, and friends, then visit www.TheTechnicalTraders.com to learn how we can help you find and execute better trades. Take a look at some of our recent winners to see how we help people, just like you, create success. We believe 2019 and 2020 will be incredible years for skilled traders and we are executing at the highest level we can to assist our members. In fact, we are about to launch our newest technology solution to better assist our members in creating future success. Isn’t it time you invested in your future success by joining a team of professionals dedicated to giving you an advantage in the markets every day?
Chris Vermeulen
www.TheTechnicalTraders.com
Chris Vermeulen has been involved in the markets since 1997 and is the founder of Technical Traders Ltd. He is an internationally recognized technical analyst, trader, and is the author of the book: 7 Steps to Win With Logic
Through years of research, trading and helping individual traders around the world. He learned that many traders have great trading ideas, but they lack one thing, they struggle to execute trades in a systematic way for consistent results. Chris helps educate traders with a three-hour video course that can change your trading results for the better.
His mission is to help his clients boost their trading performance while reducing market exposure and portfolio volatility.
He is a regular speaker on HoweStreet.com, and the FinancialSurvivorNetwork radio shows. Chris was also featured on the cover of AmalgaTrader Magazine, and contributes articles to several leading financial hubs like MarketOracle.co.uk
Disclaimer: Nothing in this report should be construed as a solicitation to buy or sell any securities mentioned. Technical Traders Ltd., its owners and the author of this report are not registered broker-dealers or financial advisors. Before investing in any securities, you should consult with your financial advisor and a registered broker-dealer. Never make an investment based solely on what you read in an online or printed report, including this report, especially if the investment involves a small, thinly-traded company that isn’t well known. Technical Traders Ltd. and the author of this report has been paid by Cardiff Energy Corp. In addition, the author owns shares of Cardiff Energy Corp. and would also benefit from volume and price appreciation of its stock. The information provided here within should not be construed as a financial analysis but rather as an advertisement. The author’s views and opinions regarding the companies featured in reports are his own views and are based on information that he has researched independently and has received, which the author assumes to be reliable. Technical Traders Ltd. and the author of this report do not guarantee the accuracy, completeness, or usefulness of any content of this report, nor its fitness for any particular purpose. Lastly, the author does not guarantee that any of the companies mentioned in the reports will perform as expected, and any comparisons made to other companies may not be valid or come into effect.
Chris Vermeulen Archive |
© 2005-2022 http://www.MarketOracle.co.uk - The Market Oracle is a FREE Daily Financial Markets Analysis & Forecasting online publication.