


Various Stock Market Indicators are Plunging. Run for the Hills!
Stock-Markets / Stock Markets 2019 Mar 09, 2019 - 03:23 PM GMTBy: Troy_Bombardia

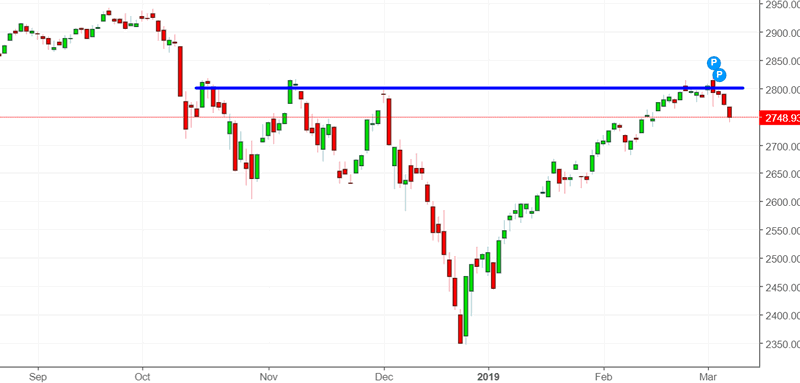
The S&P 500 is pulling back from its 2800 resistance. Meanwhile, the latest readings for various widely publicized technical and fundamental indicators plunged. And right on cue, mainstream financial media broadcasted these indicators with a megaphone because hey, nothing sells like bad news. (Modern day finance is all about the marketing hype).
Go here to understand our fundamentals-driven long term outlook.
Let’s determine the stock market’s most probable medium term direction by objectively quantifying technical analysis. For reference, here’s the random probability of the U.S. stock market going up on any given day.

*Probability ≠ certainty. Past performance ≠ future performance. But if you don’t use the past as a guide, you are blindly “guessing” the future.
Household networth
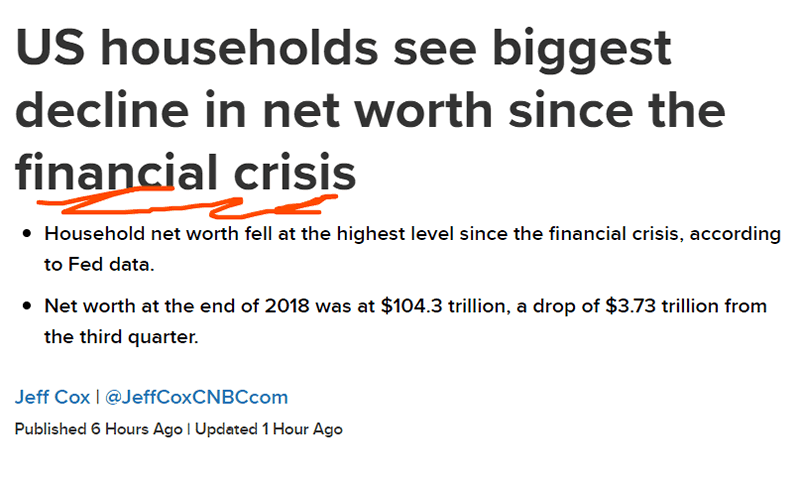
Household networth in Q4 2018 fell almost 4%. And of course, the media sensationalized this fact as “the biggest decline in household net worth since the financial crisis” (insert scary music). Any indicator that relates today to the financial crisis is a marketer’s journalist’s wet dream. Marketer’s know that the best way to attract attention is to stoke peoples’ biggest desires or biggest fears.
Should a rational investor/trader run for the hills because household networth plunged in Q4 2018?
No. There are reasons to be bearish, but this isn’t one of them.
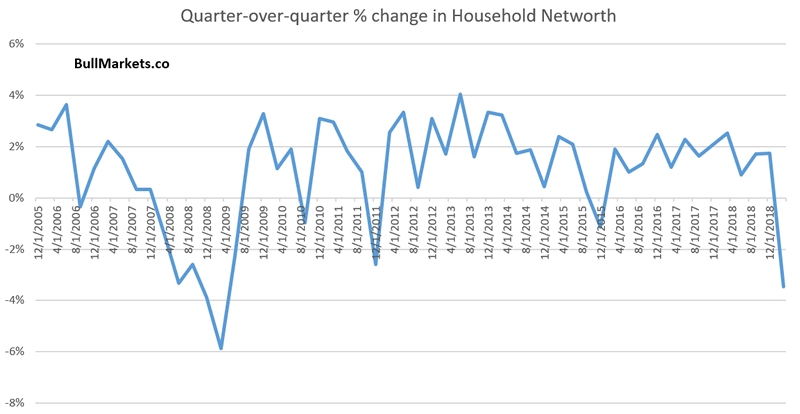
Here’s a long term chart to put the “plunge” into perspective.
More importantly, household networth is a coincident indicator for the stock market. It plunged because asset values fell significantly in Q4 2018. Turning bearish just because the market is falling is nonsensical.
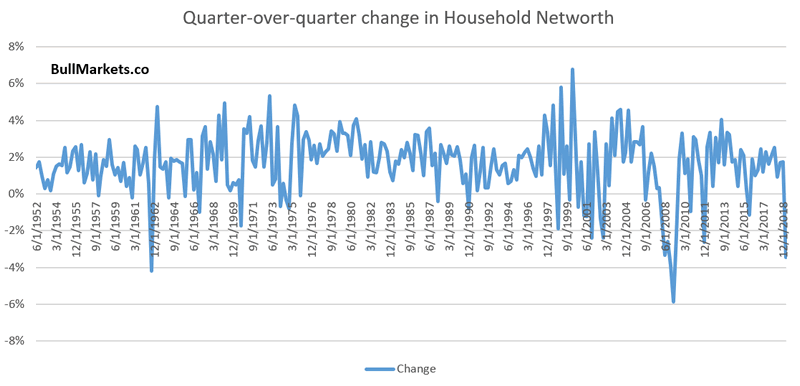
As you can see in the above chart, household networth plunges whenever the stock market experiences a weak quarter (counting from the first day of the quarter to last day of the quarter). A stock market crash typically coincides with weakness in other financial assets as well.
This is coincident. It has no predictive value.
Here’s what happens next to the S&P when the inflation-adjusted household networth falls more than -3% in one quarter.
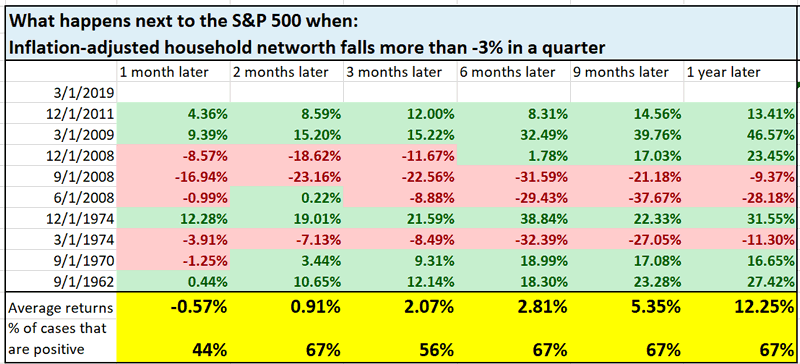
Future returns are mostly random.
Citigroup Economic Surprise Index
Here’s another often-used marketing trick from financial experts and trading gurus
- Overlap the S&P 500 onto another indicator. Make sure that the S&P and this indicator had a decent correlation over recent past.
- Demonstrate how the S&P is “decoupling” with the indicator right now.
- Adjust the scales on the S&P and indicator to increase the effect
- Crash crash crash crash.
*You see this trick on the WSJ and Zerohedge all the time.
Here’s an example. The Citigroup Economic Surprise Index has “decoupled” with the S&P, which “suggests that the stock market will crash”.
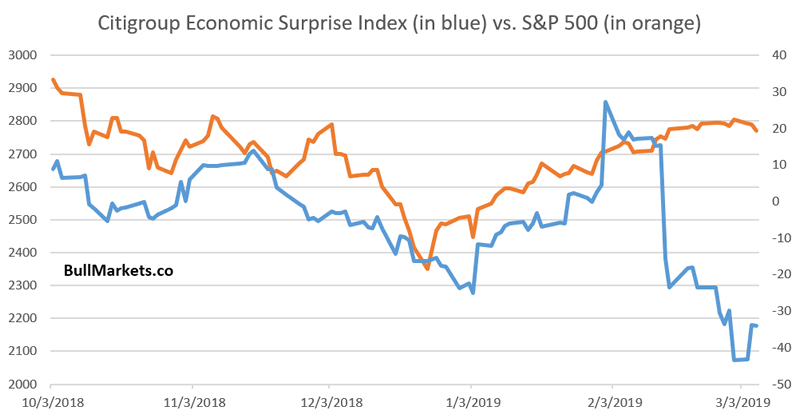
A rational trader/investor would look at the bigger picture and examine how useful these correlations actually are. Correlations break all the time. Not exactly “decoupling”.
Here’s a longer term look at the Citigroup Economic Surprise Index.
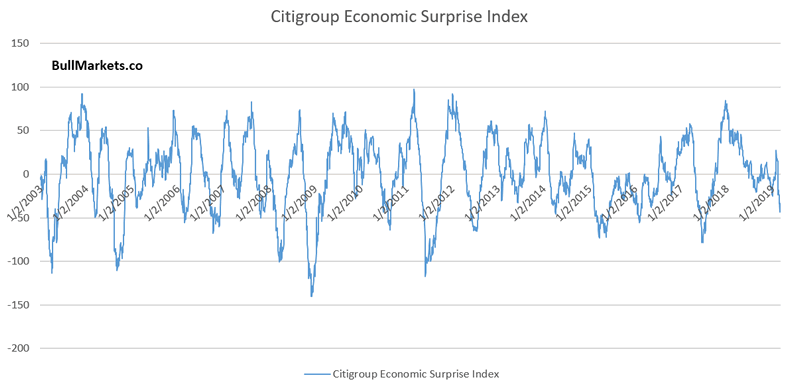
This index was recently at -43, which is the lowest reading since 2017.
Historically, such readings more more bullish than bearish for the S&P 3 months and 9 months later.
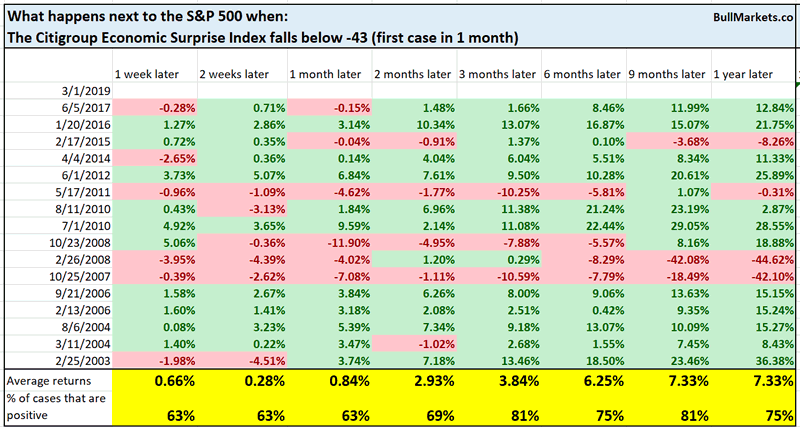
Why?
Because the Citigroup Economic Surprise Index doesn’t measure the state of the economy. It merely measures the state of economic data versus analysts’ expectations. Reality vs. expectation is a cycle. When reality constantly disappoints expectation, it will likely soon start to beat expectations.
Smart Money Flow
Here’s another recent chart that became quite popular in financial media. This demonstrates the S&P “decoupling” with the Smart Money Flow Index. Of course, the chart is an optical illusion that tries to convince you why stocks will crash and “reconnect” with the Smart Money Flow Index.
*Click here to learn more about the Smart Money Flow Index
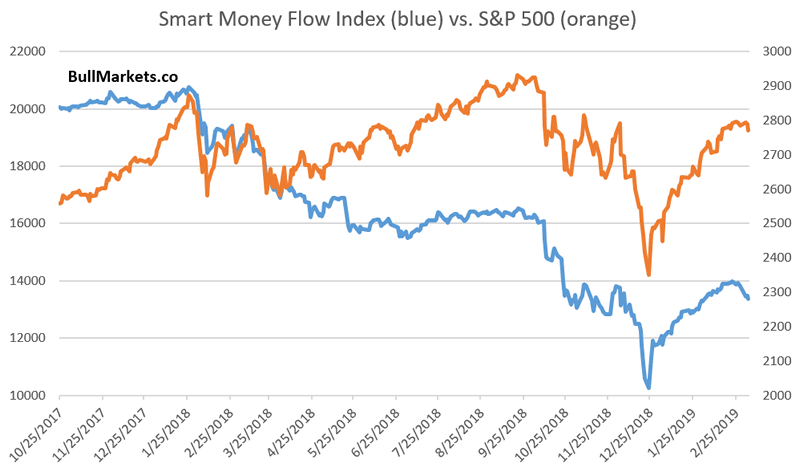
And once again, this is nothing more than an optical illusion used by financial marketers. Here’s a long term chart of the Smart Money Flow Index.
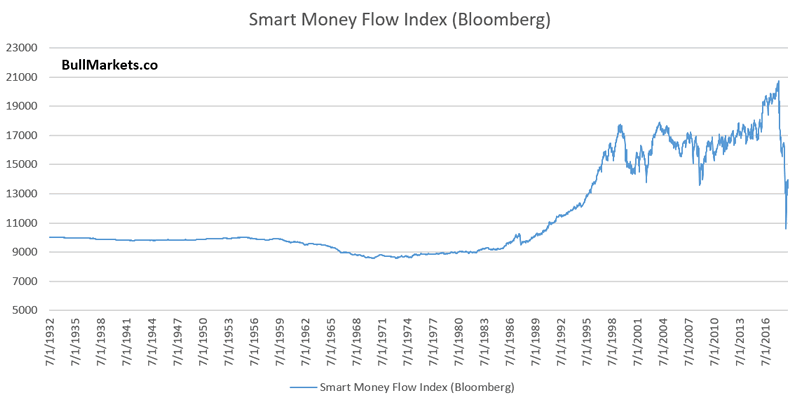
As you can see, the S&P and Smart Money Flow Index “decouple” all the time. These “divergences” can last for years, if not decades. When a “divergence” lasts for years, it’s not called a divergence. It’s called “useless”.
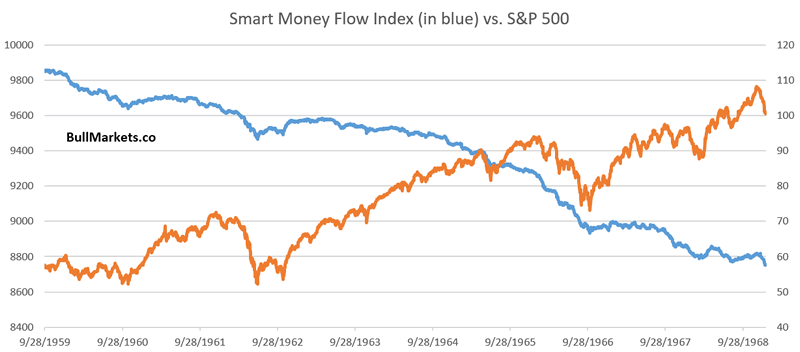
Here’s the S&P “decoupling” from the Smart Money Flow Index throughout the entire 1960s.
Here’s the S&P “decoupling” from the Smart Money Flow Index from 2003-2006.
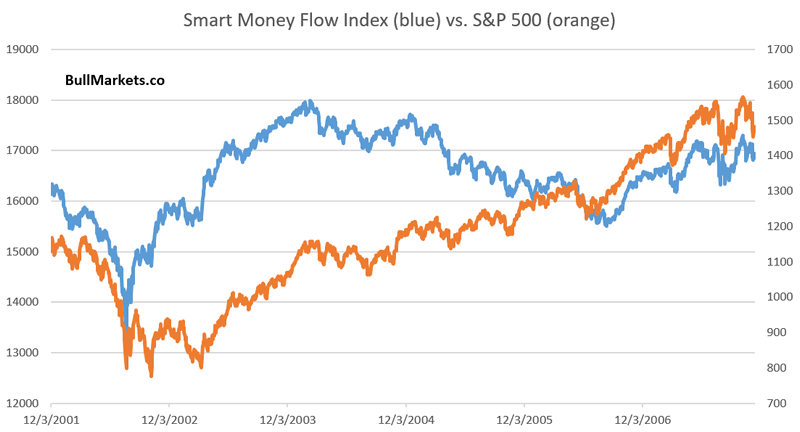
Not consistently useful as a sell signal.
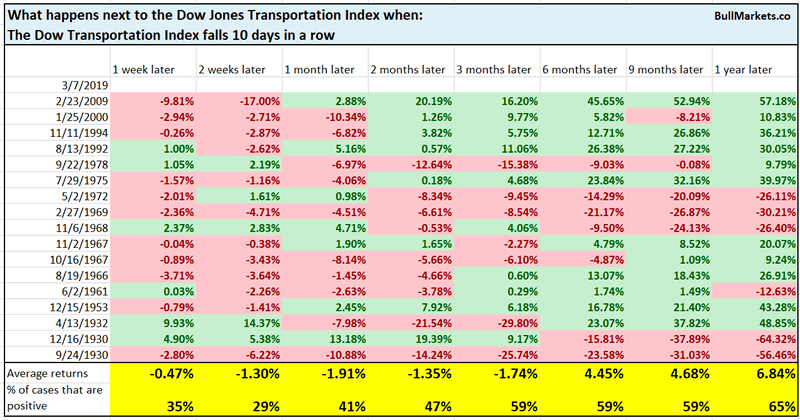
Dow Transportation Index
The Dow Jones Transportation Index has fallen 10 days in a row, which means that it’s much weaker than the Dow Jones Industrial Average.
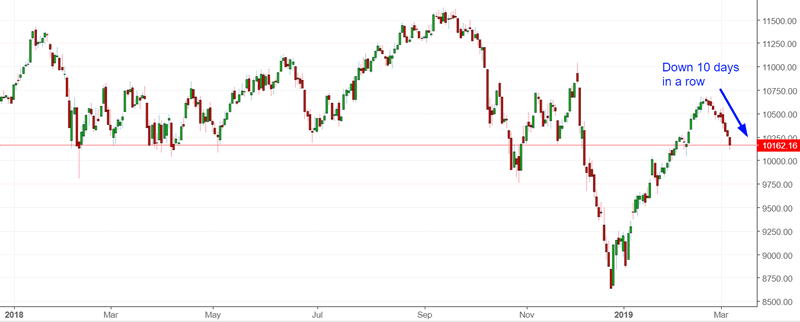
Historically, these losing streaks were short term bearish for the Dow Jones Transportation Index over the next month.
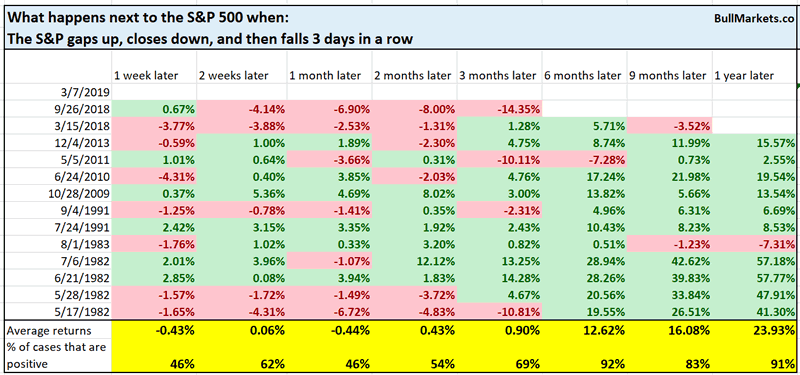
Reversal pattern
Based on pattern and chart analysis, the S&P 500 seems to have made a bearish reversal pattern. The S&P gapped up on Monday, closed down, and then fell 3 days in a row.
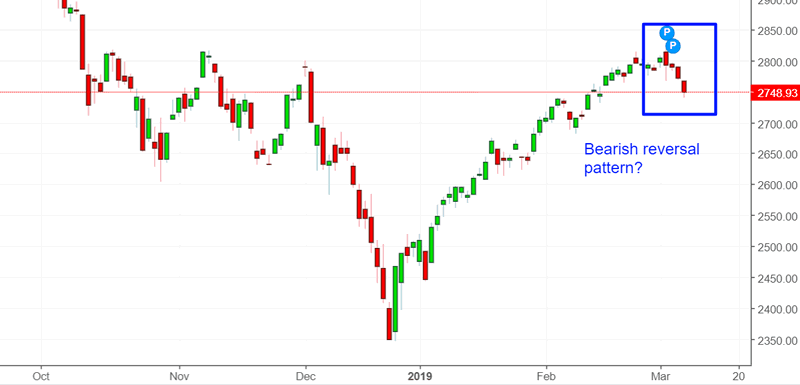
Is this really bearish, as the textbooks suggest?
No. Similar historical cases were mostly random for the S&P in the short term, but bullish 6-12 months later.
Technical analysis
I spend a lot of time scouring the internet and books to see what’s popular in trading and finance. This is the best way to learn. See what’s popular, see what others are doing, and then do your own testing to see if what you learned actually works. (You’d be surprised to learn that most of what’s taught popular is no better than a 50/50 coin toss). Even better, improve on the work of others.
- Keep what works.
- Discard whta doesn’t work.
- Improve what works.
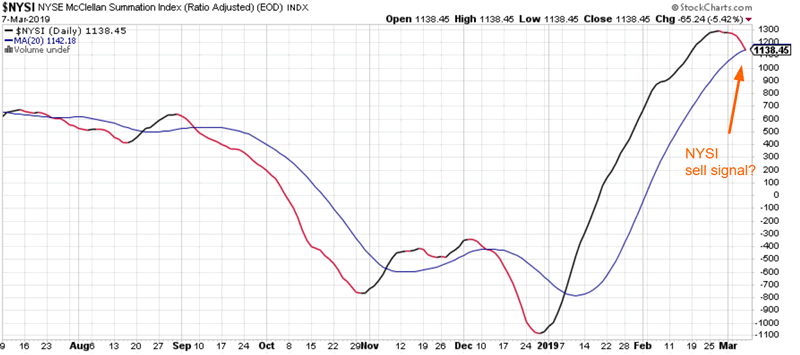
The NYSE McClellan Summation Index fell below its 20 dma today for the first time in 2 months. Traditional technical analysis sees this as a “weakening breadth SELL signal”. Is it?
Here’s what happens next to the S&P when the NYSE McClellan Summation Index falls below its 20 dma for the first time in 2 months.
*Data from 1998-present
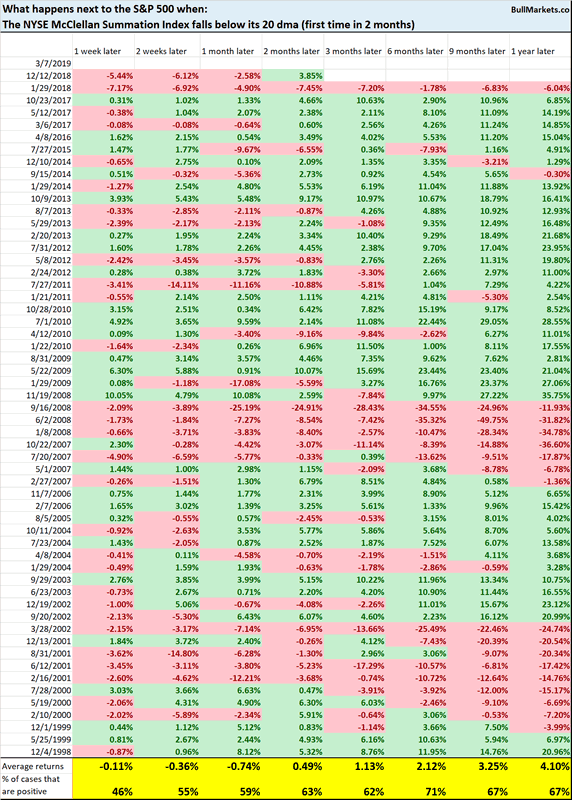
The S&P’s forward returns are mostly random, aside from a slight 1 week bearish lean. This “bearish pattern” isn’t so bearish after all.
Moral of the story, don’t use a strategy/indicator just because it’s popular. As a mentor used to say, would you jump out of a window just because your friend jumped out of the window?
Click here for yesterday’s market analysis
Conclusion
Here is our discretionary market outlook:
- The U.S. stock market’s long term risk:reward is no longer bullish. In a most optimistic scenario, the bull market probably has 1 year left. Long term risk:reward is more important than trying to predict exact tops and bottoms.
- The medium term direction (e.g. next 6-9 months) is more bullish than bearish.
- The stock market’s short term has a bearish lean due to the large probability of a pullback/retest. Focus on the medium-long term (and especially the long term) because the short term is extremely hard to predict.
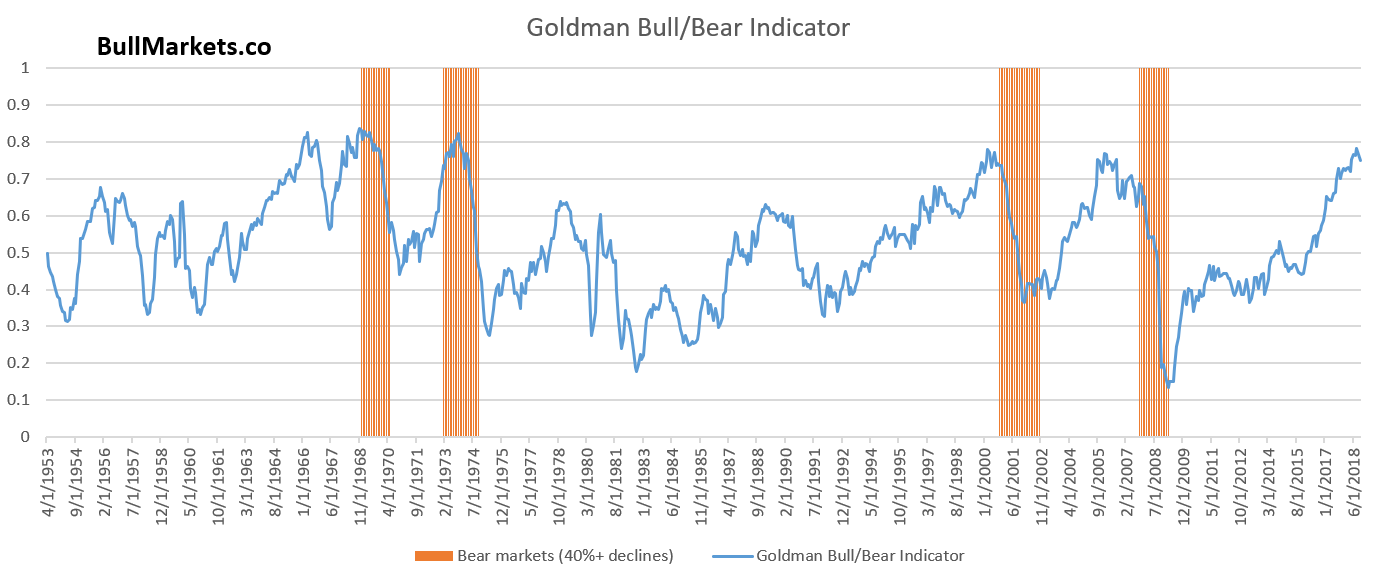
Goldman Sachs’ Bull/Bear Indicator demonstrates that while the bull market’s top isn’t necessarily in, risk:reward does favor long term bears.
Our discretionary outlook is not a reflection of how we’re trading the markets right now. We trade based on our quantitative trading models.
Members can see exactly how we’re trading the U.S. stock market right now based on our trading models.
Click here for more market studies
By Troy Bombardia
I’m Troy Bombardia, the author behind BullMarkets.co. I used to run a hedge fund, but closed it due to a major health scare. I am now enjoying life and simply investing/trading my own account. I focus on long term performance and ignore short term performance.
Copyright 2019 © Troy Bombardia - All Rights Reserved
Disclaimer: The above is a matter of opinion provided for general information purposes only and is not intended as investment advice. Information and analysis above are derived from sources and utilising methods believed to be reliable, but we cannot accept responsibility for any losses you may incur as a result of this analysis. Individuals should consult with their personal financial advisors.
© 2005-2022 http://www.MarketOracle.co.uk - The Market Oracle is a FREE Daily Financial Markets Analysis & Forecasting online publication.