


Stock Market Long-Term Predictive Software Suggests Volatility May Surge
Stock-Markets / Stock Markets 2019 Oct 31, 2019 - 04:46 PM GMTBy: Chris_Vermeulen

 Over the past few weeks and months, a number of key economic data has continued to rally the US major indexes towards new highs, hopes of a US/China trade deal, a continued shift of capital in the US markets for protection and safety, and moderately strong US economic indicators and an earning season that appears to be moderately strong for Q3 of 2019. The interesting facet of this move higher is that it is happening while trading volume has diminished dramatically in the SPY. The futures contracts, the ES, YM, and NQ, continue to show relatively strong volume activity though.
Additionally, the overnight Repo markets have risen to the attention of many skilled analysts. The concern is that the continued US Fed support of the overnight Repo facility may be a band-aid attempt to support a gaping credit crisis that is brewing just outside of view. We’ve been doing quite a bit of research over the past few weeks regarding this Repo market support by the US Fed and we believe there is more to it than many believe. We believe certain institutional banking firms may be at extreme risks related to derivative investments, shadow banking activities and/or global commodity/stock/currency/asset risk exposure. The only answer we have for the extended Repo facility at increasing levels is that the institutional banking system is starting to “fray around the edges”. Thus, we believe some larger credit risk problems may be just around the corner.
Our longer-term analysis continues to suggest that “all is fine – until it is not”. Our belief that a capital shift that has been taking place over the past 5+ years where foreign capital continues to pour into the US markets is driving US stock market prices higher. There is evidence that the capital shift into the US has slowed over the past 5+ months, yet one would not notice this by looking at these longer-term charts. The point we are trying to make today is that price peaks near current highs have, historically, been met with strong resistance and collapsed by 8 to 15% on average.
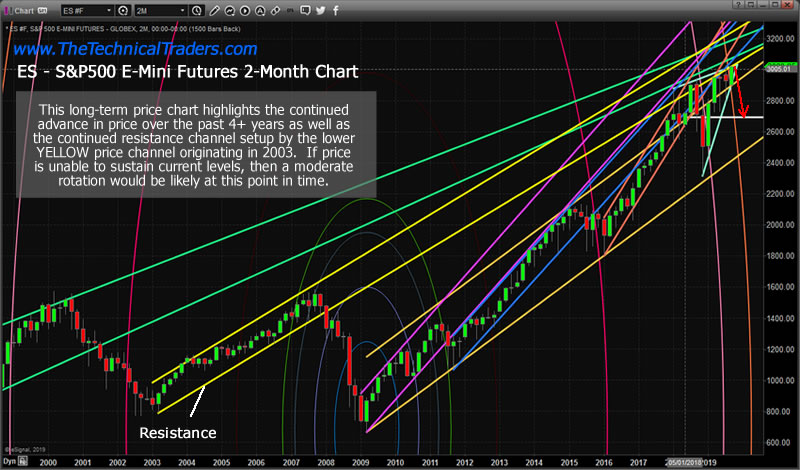
SP500 Index – 2 Month Long Term Chart
This ES 2 Month chart highlights the resistance channel initiated near the 2003 lows (the lower YELLOW price channel line) and how that level has continued to act as moderate price resistance throughout most of 2017, 2018 and 2019. We believe that price, at current levels, must either rally above this level and be capable of sustaining higher price levels (which would be supported by stronger forward guidance, earnings, economic data and/or investments), or will attempt to rotate lower from these current highs because price is simply unable to support/sustain higher price levels given the current global economic data.
When we attempt to rationalize the potential for price given the Repo issues, the current global economic data/news, the uncertainty of a US Presidential election cycle only 12 months away, the BREXIT deal hanging out in the near future and recent currency rotations, we believe is transitional shift is taking place in the markets in preparation for some type of surge in volatility associated with a very strong potential for extended price rotation.
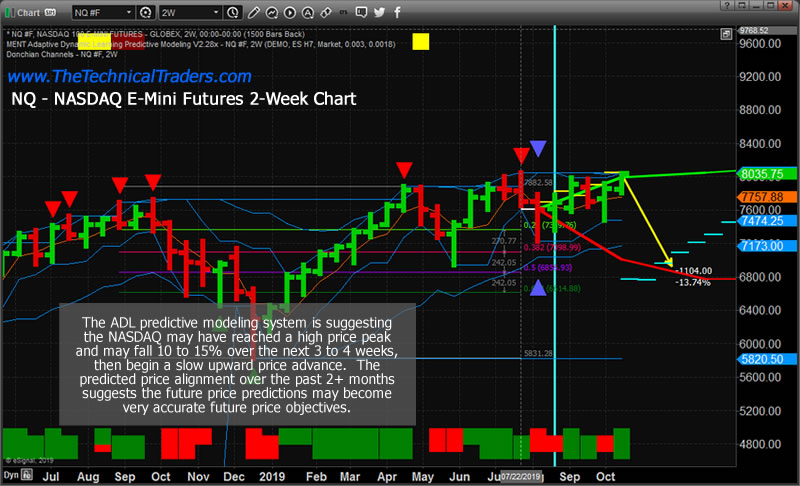
NASDAQ 2 Week Chart – Adaptive Dynamic Learning (ADL)
Our Adaptive Dynamic Learning (ADL) price modeling system on this NQ 2-Week chart highlights what the ADL system suggests as a moderate price rotation setting up over the next 2 to 8+ weeks. This data originates on August 5, 2019, and the alignment of the future predicted price levels (the DASHES) on this chart shows how accurate the ADL future price predictions have been over the past 3+ months. Currently, the ADL predictive modeling system is suggesting a price reversion is about to take place in the NQ where price may fall 10 to 15% over the next 2 to 6+ weeks. Then, the price will attempt to set up a momentum base and begin to move higher near the end of 2019 or early into 2020.
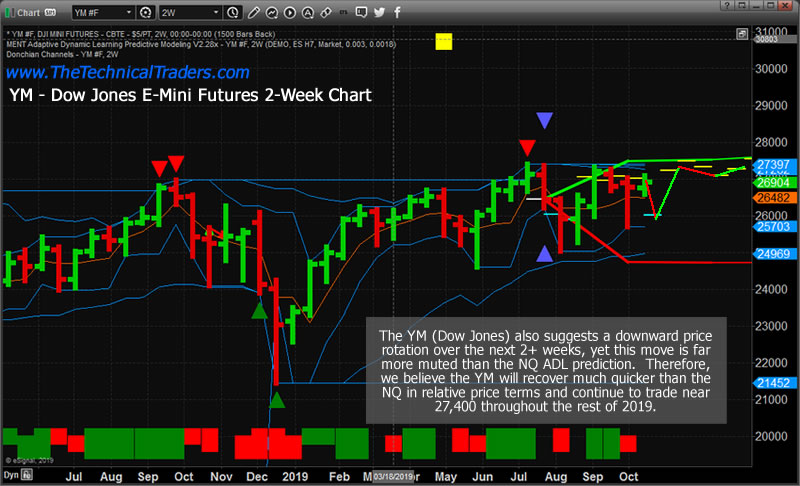
DOW 2 Week Chart – Adaptive Dynamic Learning (ADL)
This YM 2-Week chart showing the same type of ADL predicted price levels suggests the YM may also see some type of price reversion, yet the size of this reversion is much smaller than the NQ. The ADL predictive modeling system is suggesting the YM may rotate to levels near 26,000 or lower before finding immediate support and attempting a renewed rally back to levels near 27,000.
Concluding Thoughts:
What this suggests is that the NASDAQ and S&P500 may become much more volatile than the Dow Jones index over the next 2 to 6+ weeks. Volatility may surge on a reversion move in the ES and NQ over the next few months while the YM remains rather calm comparatively. Skilled traders must understand that subtle risks are starting to show throughout the global markets. Foreign markets are starting to show signs of extended contraction – China and Asia in particular. The situation in Europe and with the Euro are open to interpretation. Our opinion is that risk levels have already exceeded a comfort level in this arena.
Should some event take place where the global banking system and/or Repo market continue to attempt to take up the slack – traders will become even more concerned that “something is broken” and could pull massive amounts of capital out of the markets fairly quickly. If this happens when volume and volatility are very low, we have a situation where simple price exploration could present a real problem (think FLASH CRASH).
Skilled traders need to stay very cautious near these new highs. We may see a surge in volatility over the next few weeks unless the markets are able to settle the concerns raised by analysts and others. Headed into the end of 2019, into a contentious US presidential election cycle and with obvious signs that something may be breaking in the global banking system, now is the time to protect and prepare for the unknown. We can’t make this any clearer – consider this a warning alert from www.TheTechnicalTraders.com.
Chris Vermeulen
www.TheTechnicalTraders.com
Chris Vermeulen has been involved in the markets since 1997 and is the founder of Technical Traders Ltd. He is an internationally recognized technical analyst, trader, and is the author of the book: 7 Steps to Win With Logic
Through years of research, trading and helping individual traders around the world. He learned that many traders have great trading ideas, but they lack one thing, they struggle to execute trades in a systematic way for consistent results. Chris helps educate traders with a three-hour video course that can change your trading results for the better.
His mission is to help his clients boost their trading performance while reducing market exposure and portfolio volatility.
He is a regular speaker on HoweStreet.com, and the FinancialSurvivorNetwork radio shows. Chris was also featured on the cover of AmalgaTrader Magazine, and contributes articles to several leading financial hubs like MarketOracle.co.uk
Disclaimer: Nothing in this report should be construed as a solicitation to buy or sell any securities mentioned. Technical Traders Ltd., its owners and the author of this report are not registered broker-dealers or financial advisors. Before investing in any securities, you should consult with your financial advisor and a registered broker-dealer. Never make an investment based solely on what you read in an online or printed report, including this report, especially if the investment involves a small, thinly-traded company that isn’t well known. Technical Traders Ltd. and the author of this report has been paid by Cardiff Energy Corp. In addition, the author owns shares of Cardiff Energy Corp. and would also benefit from volume and price appreciation of its stock. The information provided here within should not be construed as a financial analysis but rather as an advertisement. The author’s views and opinions regarding the companies featured in reports are his own views and are based on information that he has researched independently and has received, which the author assumes to be reliable. Technical Traders Ltd. and the author of this report do not guarantee the accuracy, completeness, or usefulness of any content of this report, nor its fitness for any particular purpose. Lastly, the author does not guarantee that any of the companies mentioned in the reports will perform as expected, and any comparisons made to other companies may not be valid or come into effect.
Chris Vermeulen Archive |
© 2005-2022 http://www.MarketOracle.co.uk - The Market Oracle is a FREE Daily Financial Markets Analysis & Forecasting online publication.